
Assessing Sampo’s Outlook After Solid 2024 Gains and Analyst Upgrades
If you’re eyeing Sampo Oyj’s stock right now and wondering whether it’s a buy, a hold, or something to leave on the watchlist, you’re certainly not alone. This well-known Nordic financial heavyweight has been making waves in the market, sometimes quietly, sometimes more dramatically, and investors are right to want answers. Despite giving up around 1.1% over the past week and slipping 0.5% for the month, Sampo still shows a striking year-to-date gain of 23.3% and an impressive 100.1% return over the last five years. Even the one-year performance, up 22.5%, signals that the market’s broader mood around insurers and financials is tilting more positive, possibly in response to steady macro trends and evolving investor risk appetites.
With a current value score of 3 out of 6, Sampo comes across as undervalued in several, but not all, key valuation checks. For those deciding whether the stock’s next move will be higher or if the best days are behind, a closer look at how Sampo stacks up against some classic valuation yardsticks will be crucial. We’ll dive into exactly how the numbers look by the most common standards of value, and also explore an even smarter approach to understanding what makes a stock like Sampo tempting or concerning. Let’s break down the methods and, later, reveal how to get to the heart of valuation beyond what the numbers say at first glance.
Why Sampo Oyj is lagging behind its peers
Approach 1: Sampo Oyj Excess Returns Analysis
The Excess Returns Model sheds light on how efficiently Sampo Oyj generates profits above its cost of equity, which is a key driver of long-term value for investors. Rather than relying solely on accounting profits or market multiples, this method focuses on how much value management creates by putting shareholders’ funds to work.
For Sampo Oyj, the main figures stand out: the company has a Book Value of €2.54 per share and a Stable Earnings Per Share (EPS) of €0.56, based on consensus Return on Equity estimates from 10 analysts. The average expected Return on Equity is robust at 19.56%, while the Stable Book Value estimate rises to €2.89, compiled from inputs by 6 analysts. After subtracting a Cost of Equity of €0.16 per share, Sampo achieves an Excess Return of €0.41 per share. Collectively, this suggests that Sampo’s returns are not just solid but consistently exceed the minimum returns required by shareholders.
Translating these results into value, the Excess Returns Model estimates Sampo’s intrinsic value at €13.88 per share. With the current share price trading close to 29.5% below this figure, Sampo appears significantly undervalued when evaluated by its ability to deliver excess shareholder gains versus its equity cost. For investors seeking compounders in financials, this adds a decisive check in Sampo's favor.
Result: UNDERVALUED
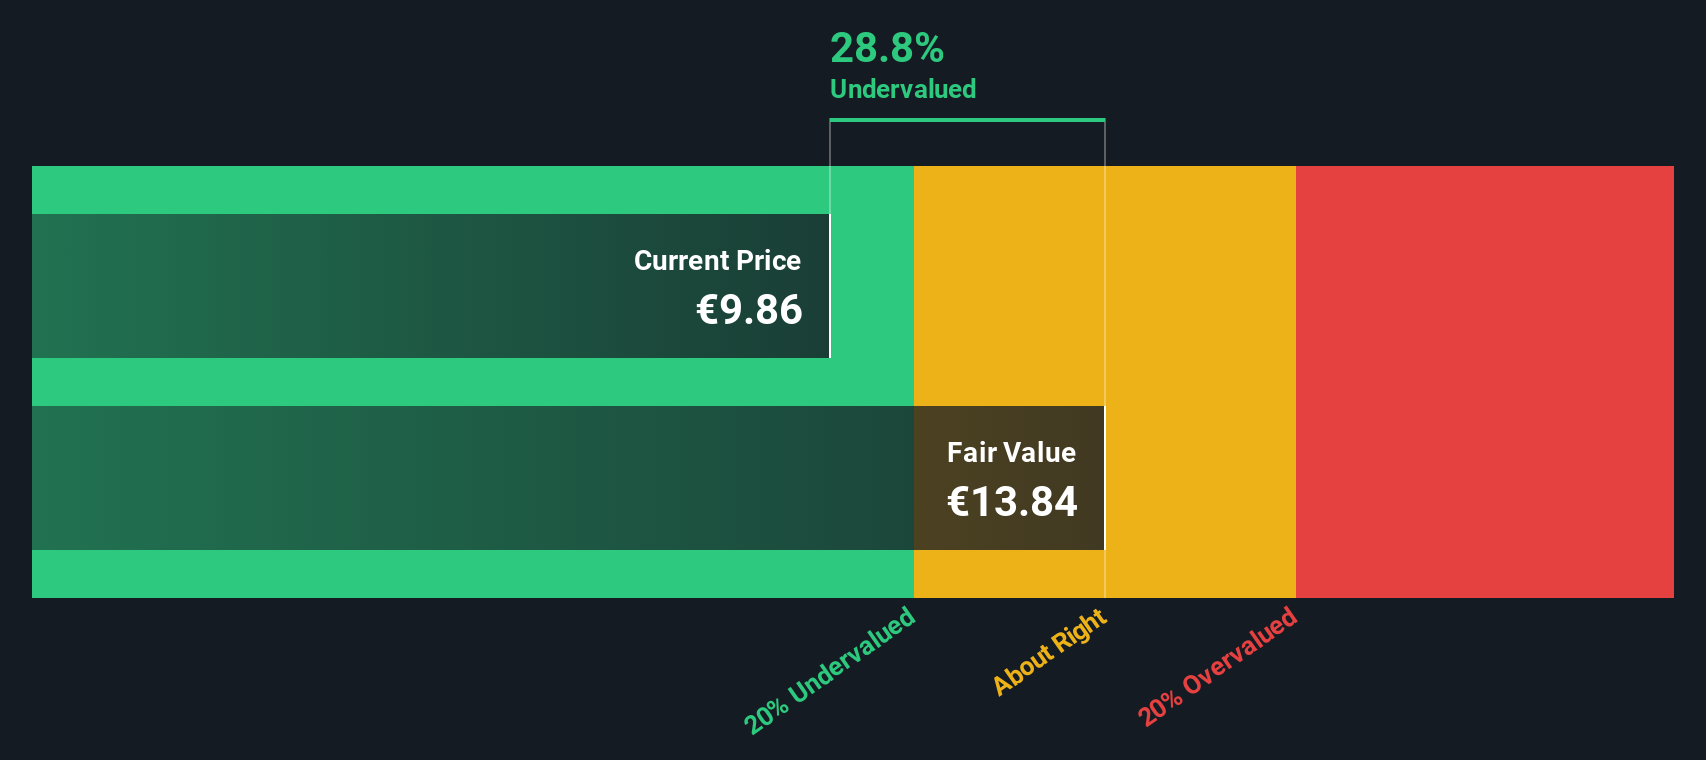
Our Excess Returns analysis suggests Sampo Oyj is undervalued by 29.5%. Track this in your watchlist or portfolio, or discover more undervalued stocks.
Approach 2: Sampo Oyj Price vs Earnings
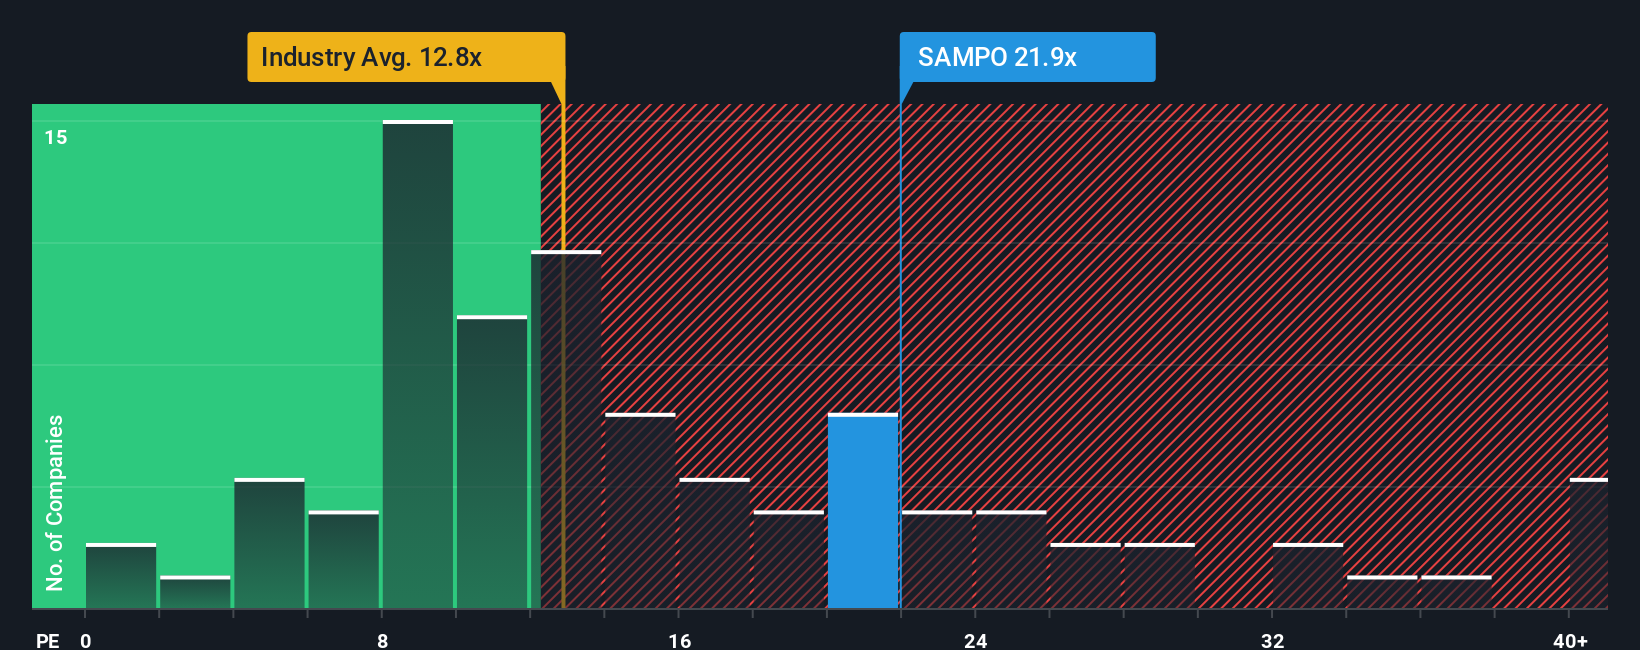
The price-to-earnings (PE) ratio is often the go-to metric for valuing profitable companies like Sampo Oyj, as it directly connects a company’s share price with its actual earnings power. This makes it especially handy when you want to compare companies across the same sector or gauge what investors are willing to pay for each euro of profit. However, it’s important to note that a “normal” or “fair” PE ratio is never just a one-size-fits-all figure. Factors like future growth prospects and business risks can push the justified PE higher or lower.
Sampo Oyj currently trades at a PE ratio of 21.76x. That is noticeably above the insurance industry average of 12.43x and also higher than its peer group’s average PE of 13.95x. At first glance, this might suggest the stock is pricier than many of its direct competitors. However, using a straight industry or peer comparison can be misleading because it ignores the unique qualities or risks that could justify a higher valuation.
This is where Simply Wall St’s “Fair Ratio” comes in. The Fair Ratio, in this case 23.45x, estimates what a reasonable PE should be for Sampo based on both quantitative and qualitative factors including earnings growth, company size, risk level, and profit margins, all tailored to Sampo’s specific situation. Because it is tuned to these relevant details rather than broad averages, the Fair Ratio can give a more accurate representation of a company’s intrinsic value.
Comparing Sampo Oyj’s current PE of 21.76x to its Fair Ratio of 23.45x, the difference is small and well within a reasonable margin. This suggests that Sampo’s shares are trading at pretty much a fair value given its underlying performance and outlook.
Result: ABOUT RIGHT
PE ratios tell one story, but what if the real opportunity lies elsewhere? Discover companies where insiders are betting big on explosive growth.
Upgrade Your Decision Making: Choose your Sampo Oyj Narrative
Earlier in this article, we alluded to an even smarter way to look at valuation: Narratives. A Narrative is simply your story about a company, linking facts and outlooks (such as estimates for future revenue, earnings, or margins) to a financial forecast and a fair value that make sense to you. Narratives connect the dots between what’s happening in the real world and in the financial statements, capturing both quantitative forecasts and the "why" behind the numbers. On Simply Wall St’s Community page, millions of investors use Narratives as an easy, accessible tool to create, share and update their views as new information emerges. For instance, when there is company news or earnings releases, Narratives are dynamically refreshed with the latest data.
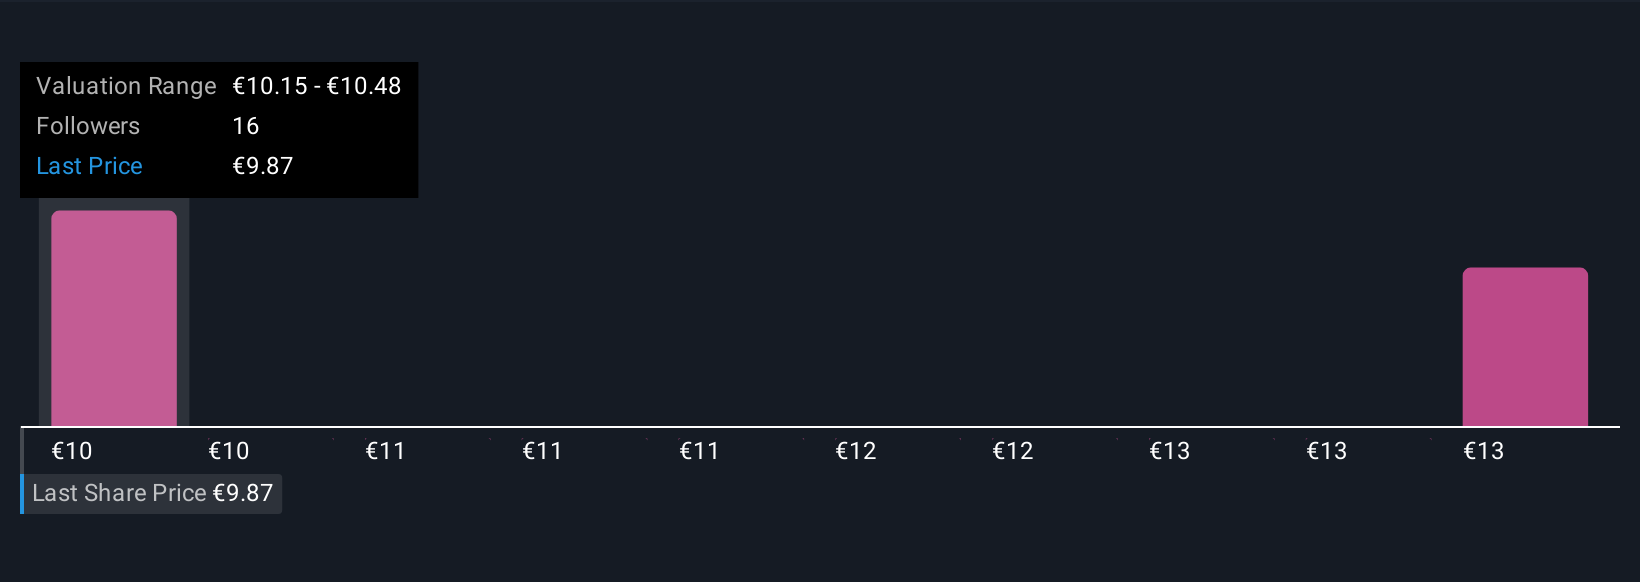
With Narratives, you can check whether Sampo Oyj looks appealing by comparing your Fair Value to the current price, giving you a clearer signal of whether to buy, hold, or sell. And since every investor has their own view, you might see bullish users valuing Sampo at €11.5 per share based on sustained earnings growth and tech adoption, while more cautious investors see fair value closer to €8.0 due to regulatory or competitive risks. Narratives put you in control, turning investment analysis from a one-size-fits-all approach into a personal, dynamic decision-making process.
Do you think there's more to the story for Sampo Oyj? Create your own Narrative to let the Community know!
This article by Simply Wall St is general in nature. We provide commentary based on historical data and analyst forecasts only using an unbiased methodology and our articles are not intended to be financial advice. It does not constitute a recommendation to buy or sell any stock, and does not take account of your objectives, or your financial situation. We aim to bring you long-term focused analysis driven by fundamental data. Note that our analysis may not factor in the latest price-sensitive company announcements or qualitative material. Simply Wall St has no position in any stocks mentioned.
Have feedback on this article? Concerned about the content? Get in touch with us directly. Alternatively, email editorial-team@simplywallst.com