
ABC-Mart (TSE:2670): Evaluating Valuation After Profit Margins Rise but Growth Slows
ABC-MartInc (TSE:2670) recently reported higher profit margins at 12.2%, outshining both last year and competing retailers. However, with September sales inching up just 1.1% to 1.3%, earnings growth now appears to be slowing.
See our latest analysis for ABC-MartInc.
Despite ABC-MartInc’s impressive jump in profit margins, the market’s response has been lukewarm, with the share price falling 12.7% over the past month and year-to-date returns still in the red. While the company’s three- and five-year total shareholder returns are up 29.4% and 75.8%, recent momentum has faded as investors weigh slowing growth against profitability improvements.
If you’re open to expanding your search beyond big retail names, now is an excellent moment to discover fast growing stocks with high insider ownership.
With shares now trading below analyst price targets and profit margins at record highs, the key question is whether ABC-MartInc is undervalued at current levels or if the market is already factoring in its slowing growth outlook.
Price-to-Earnings of 14.7x: Is it justified?
With the shares of ABC-MartInc closing at ¥2,705 and reflecting a price-to-earnings (P/E) ratio of 14.7x, the stock is trading at a modest premium compared to the JP Specialty Retail industry average of 14x, and significantly below the peer average of 23.6x. This positions the company as slightly expensive within its sector, yet still attractive against its broader peer group.
The price-to-earnings ratio measures how much investors are willing to pay for each ¥1 of earnings. It is a quick gauge for investor expectations around future profitability, growth, and current market sentiment toward those earnings. For ABC-MartInc, a P/E close to industry norms suggests the market is cautious for now, weighing strong historical profit growth against recent signs of slowing momentum and lower return on equity.
Compared to its industry, ABC-MartInc’s 14.7x ratio stands just above typical specialty retail peers, indicating a slight valuation premium. Yet, when compared to a much higher peer group average of 23.6x, the company seems attractively priced. The estimated fair price-to-earnings ratio of 17x further hints at potential upside should the market reward its quality earnings and experienced management team.
Explore the SWS fair ratio for ABC-MartInc
Result: Price-to-Earnings of 14.7x (UNDERVALUED)
However, slower revenue and earnings growth or further volatility in market sentiment could quickly reverse any short-term undervaluation seen today.
Find out about the key risks to this ABC-MartInc narrative.
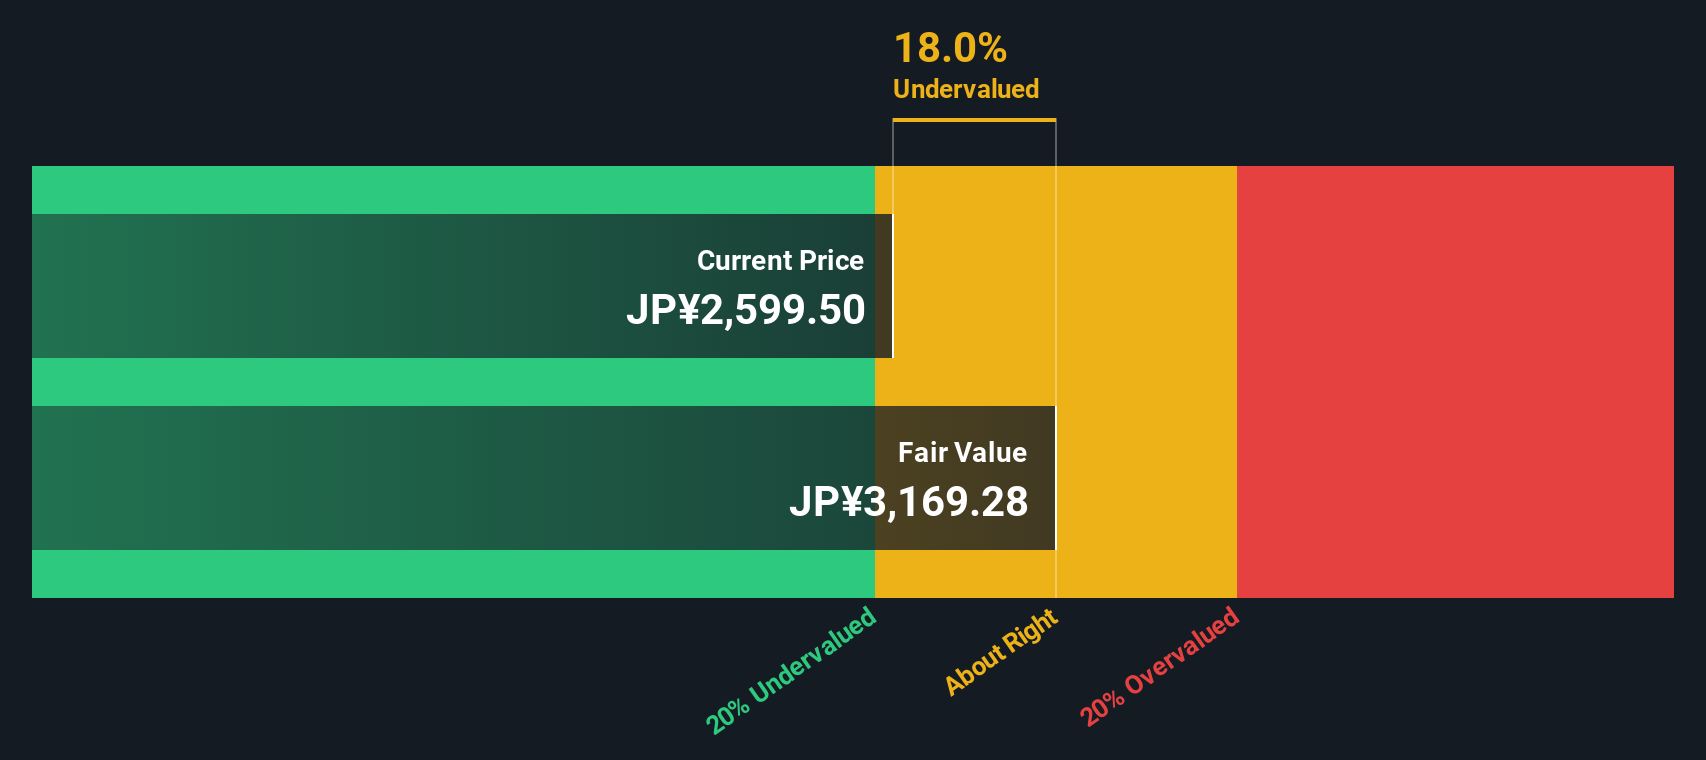
Another View: What Does the DCF Model Suggest?
Looking beyond earnings multiples, our DCF model puts ABC-MartInc’s fair value at ¥3,128.07, about 13.5% above the current share price. This method suggests shares may be undervalued. However, it relies on cash flow forecasts and market expectations, both of which could shift unexpectedly. Which view should investors trust when weighing risks and rewards?
Look into how the SWS DCF model arrives at its fair value.
Simply Wall St performs a discounted cash flow (DCF) on every stock in the world every day (check out ABC-MartInc for example). We show the entire calculation in full. You can track the result in your watchlist or portfolio and be alerted when this changes, or use our stock screener to discover undervalued stocks based on their cash flows. If you save a screener we even alert you when new companies match - so you never miss a potential opportunity.
Build Your Own ABC-MartInc Narrative
If you see things differently or want to investigate the data yourself, you can easily develop your own perspective in just a few minutes. Why not Do it your way?
A great starting point for your ABC-MartInc research is our analysis highlighting 4 key rewards and 1 important warning sign that could impact your investment decision.
Looking for more investment ideas?
You’re missing out if you limit yourself to one stock. Get ahead of the curve by checking out other compelling opportunities on Simply Wall Street’s powerful Screener.
- Tap into market potential by browsing these 887 undervalued stocks based on cash flows with strong fundamentals and attractive valuations that others might overlook.
- Generate lasting income by reviewing these 18 dividend stocks with yields > 3% that offer yields above 3% and consistent payout histories.
- Stay at the forefront of innovation by checking out these 25 AI penny stocks paving the way in artificial intelligence advancements.
This article by Simply Wall St is general in nature. We provide commentary based on historical data and analyst forecasts only using an unbiased methodology and our articles are not intended to be financial advice. It does not constitute a recommendation to buy or sell any stock, and does not take account of your objectives, or your financial situation. We aim to bring you long-term focused analysis driven by fundamental data. Note that our analysis may not factor in the latest price-sensitive company announcements or qualitative material. Simply Wall St has no position in any stocks mentioned.
Have feedback on this article? Concerned about the content? Get in touch with us directly. Alternatively, email editorial-team@simplywallst.com