
Are IREN Shares Running Ahead of Fundamentals After 77% Jump and AI Expansion News?
If you have IREN on your watchlist, you are not alone. This stock has captured the attention of both speculators and long-term investors. It is hard to ignore a name that has soared over 18% in the last week and posted a massive 77.7% climb in the past month. If that is not impressive enough, the stock's returns year-to-date are sitting at a staggering 471.4%, and its one-year gain tops 670%.
Some of these eye-popping numbers can be traced back to broader market moves favoring growth and risk assets, along with continued investor excitement in sectors where IREN operates. While recent news has been relatively light, the sustained strength reflects a shift in sentiment. This could indicate investors are recalibrating their sense of risk and reward given IREN’s role in its industry.
But here is the real question: does this rocket ride mean the stock is cheaply priced, or has the crowd pushed it well beyond what makes sense? To help you answer this, we use a straightforward valuation score for IREN. Out of six key undervaluation checks, IREN only passes one, earning a value score of 1. That number should have you curious about how the stock stacks up across various metrics.
Let’s break down those valuation approaches in detail, setting the stage for a more nuanced way to think about whether IREN is really undervalued or if there is a smarter way to judge value altogether, which we will get to at the end.
IREN scores just 1/6 on our valuation checks. See what other red flags we found in the full valuation breakdown.
Approach 1: IREN Discounted Cash Flow (DCF) Analysis
The Discounted Cash Flow (DCF) model estimates the value of a company by projecting its future cash flows and discounting them back to today’s dollars. This approach tries to capture the economic value of IREN by focusing on its expected ability to generate cash over time.
According to the DCF model for IREN, the company recently posted a last twelve months Free Cash Flow (FCF) of -$1.05 billion. Analyst forecasts expect a turnaround, with FCF projected to improve and potentially reach $925 million by 2035. For context, estimates exist up to 2027, where positive FCFs are anticipated, and the rest of the 10-year forecast is extrapolated based on historical and industry assumptions.
When we crunch these numbers and discount them back using the 2 Stage Free Cash Flow to Equity method, the resulting estimated intrinsic value for IREN lands at $43.57 per share. This is notably lower than the current share price. This suggests a 37.2% premium, meaning the market price is well above what the cash flow analysis supports, and the stock looks overvalued from this perspective.
Result: OVERVALUED
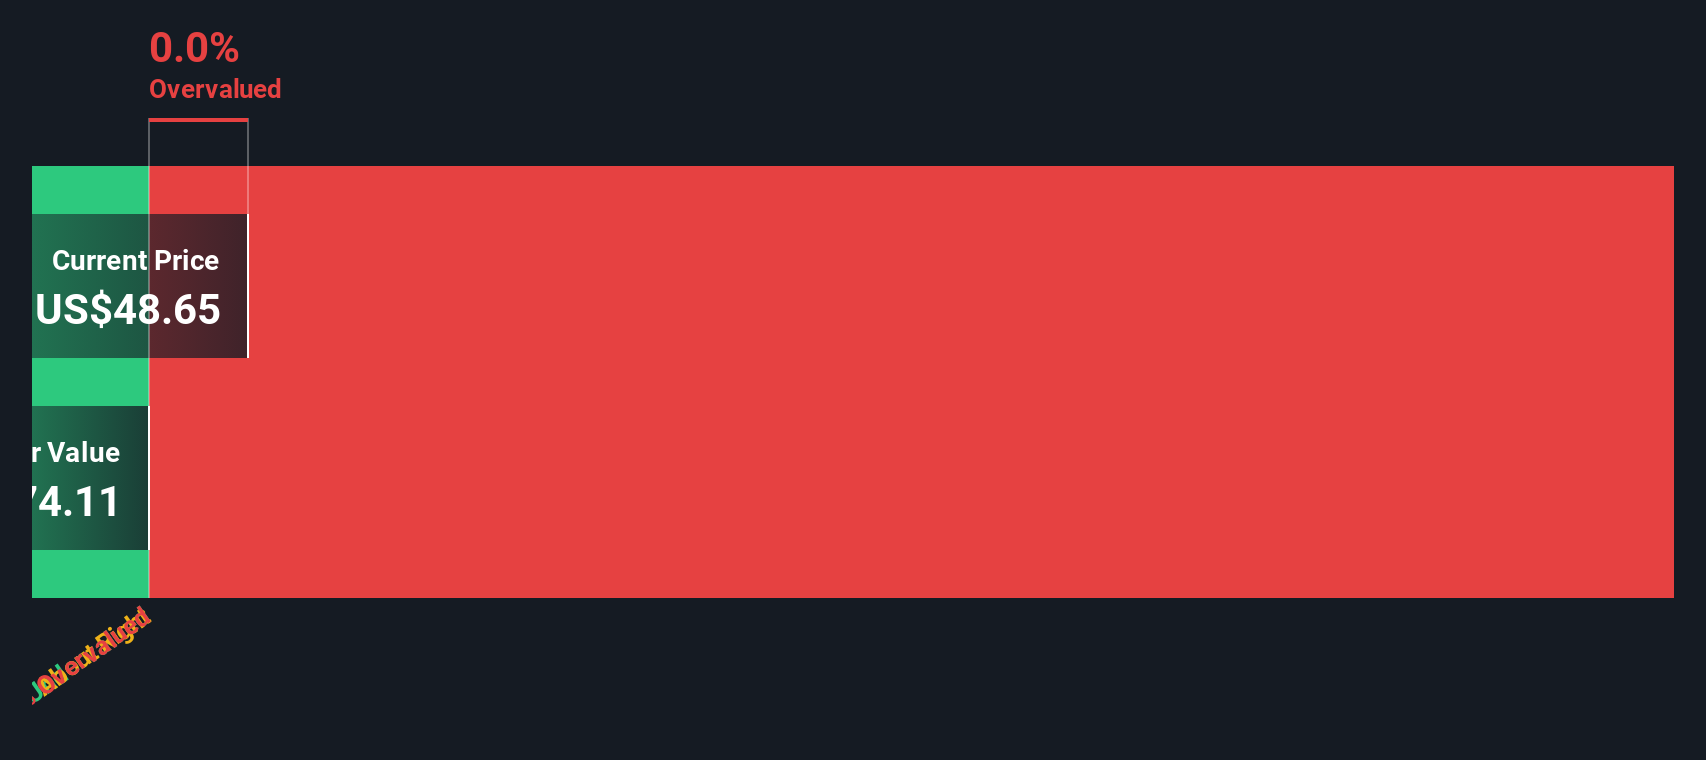
Our Discounted Cash Flow (DCF) analysis suggests IREN may be overvalued by 37.2%. Find undervalued stocks or create your own screener to find better value opportunities.
Approach 2: IREN Price vs Sales (P/S)
The Price-to-Sales (P/S) ratio is a popular metric for valuing companies, especially those in high-growth or earlier-stage markets, like IREN, where profits may be volatile or negative. It is useful because it relates the market value of a company directly to its actual sales, making it less susceptible to accounting choices affecting earnings than some other ratios.
Growth expectations and risk play a big role in setting what a "normal" or "fair" P/S ratio should be. For companies expected to grow sales rapidly, investors are usually willing to pay a higher multiple, while higher risks generally reduce what people are prepared to pay.
Currently, IREN trades at a P/S multiple of 32.4x. This is well ahead of both the industry average for Software, which sits at 5.0x, and the peer group average of 35.7x. While this headline number looks high at first glance, figuring out whether it is justified involves digging a little deeper.
That is where Simply Wall St’s “Fair Ratio” comes in. Unlike a simple comparison to industry or peer averages, the Fair Ratio considers IREN’s unique mix of sales growth, profitability, risk, industry dynamics, and overall market cap. For IREN, this Fair Ratio is calculated as 18.1x. This provides a more tailored assessment of what a reasonable P/S multiple should be, given IREN’s specific circumstances, rather than a one-size-fits-all benchmark.
Comparing the Fair Ratio of 18.1x to IREN’s current P/S of 32.4x, the stock appears to be priced at a level beyond what its fundamentals would justify according to this holistic framework.
Result: OVERVALUED

PS ratios tell one story, but what if the real opportunity lies elsewhere? Discover companies where insiders are betting big on explosive growth.
Upgrade Your Decision Making: Choose your IREN Narrative
Earlier we mentioned that there is an even better way to understand valuation, so let’s introduce you to Narratives. A Narrative is a way for you to tell your story about a company by connecting the dots between your assumptions, such as future revenue, margins, and growth, and what you believe is a fair value. Narratives go far beyond raw numbers or analyst estimates, letting you anchor your investment thesis in real-world events, strategic updates, and your individual outlook for IREN.
Narratives are more than static opinions; they link a company’s journey to a financial forecast and then to a fair value per share. They are an easy and accessible feature on Simply Wall St’s Community page, already used by millions of investors to share perspectives and test different market outcomes. Narratives empower you to act with confidence by clearly showing when a gap between fair value and the current share price could be a buy or sell signal, and they update dynamically whenever new developments, earnings, or news emerge.
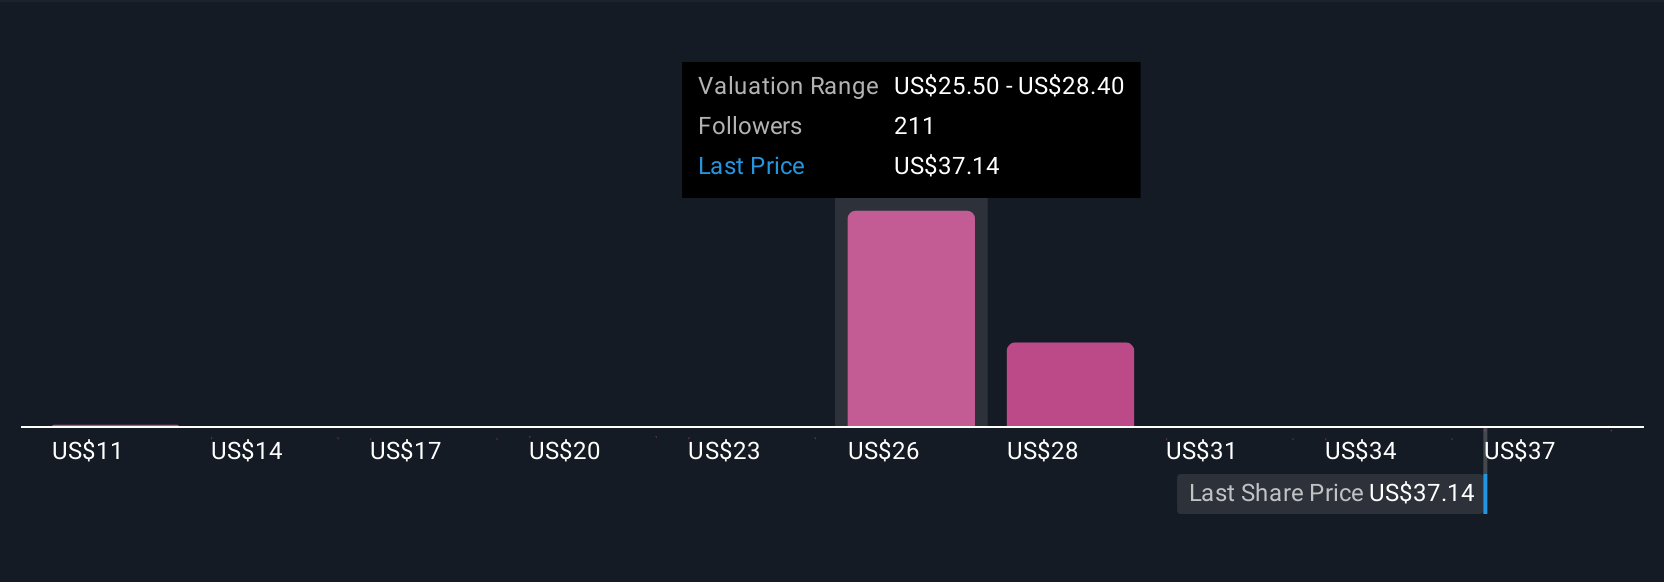
For example, right now some investors’ IREN Narratives see fair value as high as $72 per share, betting on the company’s AI expansion and rapid revenue growth, while others remain cautious with price targets closer to $11, reflecting uncertainty about dilution and Bitcoin volatility. This flexibility means you get to choose the Narrative and strategy that best fits your view.
For IREN, however, we'll make it really easy for you with previews of two leading IREN Narratives:
Fair Value: $72.52
Stock is trading at 17.6% above this fair value.
Revenue growth used in narrative: 40%
- IREN leverages 100% renewable energy across North American mining sites, aiming for industry-leading energy efficiency through new hardware upgrades.
- The company is actively diversifying into AI and HPC (high performance computing) services for additional revenue, with early traction and substantial financial reserves supporting its growth plan.
- Major upside could occur if IREN executes capacity expansion and Bitcoin prices continue upward. Risks include further equity dilution and high exposure to Bitcoin’s volatility.
Fair Value: $43.92
Stock is trading at 36.1% above this fair value.
Revenue growth used in narrative: 52.7%
- IREN’s rapid expansion in AI cloud and data centers, funded by significant debt and lease financing, may create profit margin pressure if earnings growth stalls or energy costs rise.
- The business remains highly exposed to volatile Bitcoin prices and short-term AI cloud contracts, which can risk predictable long-term earnings.
- Consensus analyst price target is near the current share price, suggesting limited upside. Concerns include sustainability of rapid capital expenditures, growing competition, and potential regulatory or environmental headwinds.
Do you think there's more to the story for IREN? Create your own Narrative to let the Community know!
This article by Simply Wall St is general in nature. We provide commentary based on historical data and analyst forecasts only using an unbiased methodology and our articles are not intended to be financial advice. It does not constitute a recommendation to buy or sell any stock, and does not take account of your objectives, or your financial situation. We aim to bring you long-term focused analysis driven by fundamental data. Note that our analysis may not factor in the latest price-sensitive company announcements or qualitative material. Simply Wall St has no position in any stocks mentioned.
Have feedback on this article? Concerned about the content? Get in touch with us directly. Alternatively, email editorial-team@simplywallst.com