
Is Fanuc’s Strong 8.5% Weekly Rally Justified After Recent Automation Momentum?
Are you watching Fanuc shares and wondering if now’s the moment to make a move? You’re not alone. Investors have seen Fanuc’s stock rise by 8.5% in just the past week and 8.0% over the last month, building on a steady track record. It is up 10.3% year-to-date and has gained 12.0% in the last twelve months. Looking even further back, the five-year return stands at an impressive 21.3%. These solid gains have come as the market keeps wrestling with changes in global manufacturing trends and automation, areas where Fanuc is widely recognized as a key player. The recent uptick suggests enthusiasm for robotics and industrial automation may be returning, shifting risk perceptions among investors who now see Fanuc’s long-term outlook in a new light.
But here’s the crucial question: does the stock’s valuation justify its recent momentum, or is it starting to run ahead of itself? Based on six key valuation checks, Fanuc currently scores a 0, which means it doesn’t appear undervalued by conventional measures. In the next section, I’ll break down each of these valuation approaches so you can get a clearer picture of how the stock stacks up. Stay tuned, because I’ll also share a perspective that goes beyond the usual valuation tools, one that could be even more important for making your decision.
Fanuc scores just 0/6 on our valuation checks. See what other red flags we found in the full valuation breakdown.
Approach 1: Fanuc Discounted Cash Flow (DCF) Analysis
The Discounted Cash Flow (DCF) model estimates a company’s intrinsic value by projecting its future free cash flows, then discounting them back to today’s value. This is a common method to determine what a business may be worth, based on its potential to generate cash over time.
For Fanuc, the current Free Cash Flow stands at ¥208.8 billion. According to analyst forecasts, annual free cash flow is expected to continue growing and reach about ¥184.9 billion in 2030. Analysts provide concrete estimates for the next five years. After this period, projections are extrapolated, so there is some added uncertainty further out. These forecasts all use Japanese Yen (¥) as the reporting currency.
Based on these projections and the 2 Stage Free Cash Flow to Equity DCF model, the estimated intrinsic value for Fanuc shares is ¥3,635.55. However, the analysis suggests Fanuc’s stock is trading at a 24.1% premium to this intrinsic value, indicating the market price is ahead of where the DCF suggests it should be.
Result: OVERVALUED
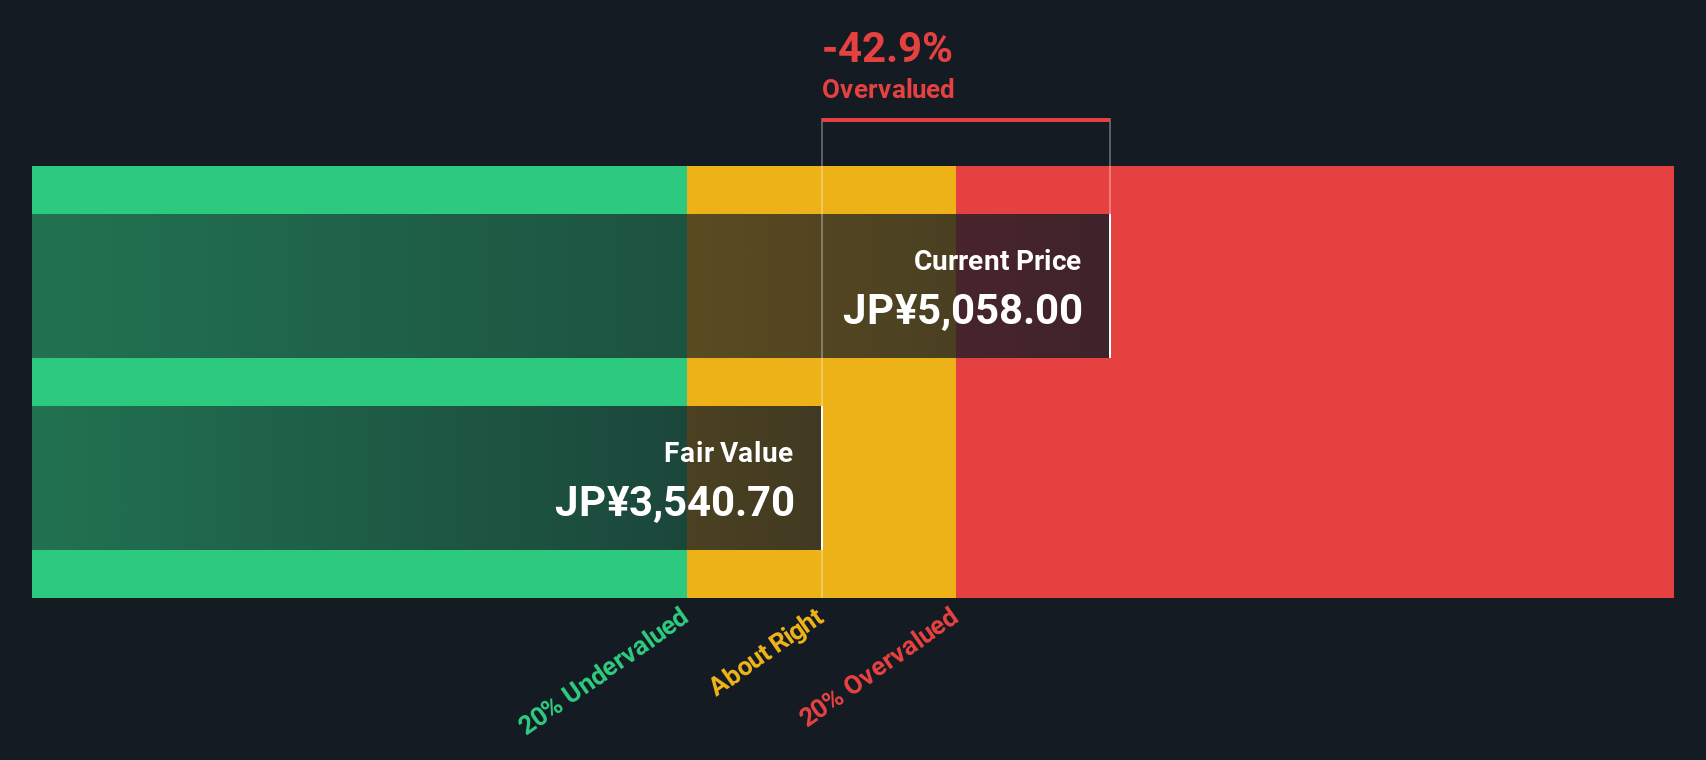
Our Discounted Cash Flow (DCF) analysis suggests Fanuc may be overvalued by 24.1%. Find undervalued stocks or create your own screener to find better value opportunities.
Approach 2: Fanuc Price vs Earnings
The Price-to-Earnings (PE) ratio is a widely used metric for valuing profitable companies like Fanuc, as it relates a company's share price to its per-share earnings. For businesses with consistent profits, the PE ratio helps investors understand how much they are paying for each unit of earnings. This makes it a useful gauge of market expectations.
Growth prospects and perceived risk play significant roles in shaping what is considered a "normal" or "fair" PE ratio. Companies with higher growth expectations or lower perceived risks often trade at higher PE multiples. This reflects investors' willingness to pay more for future potential. Conversely, lower multiples might signal market skepticism about growth or greater uncertainty.
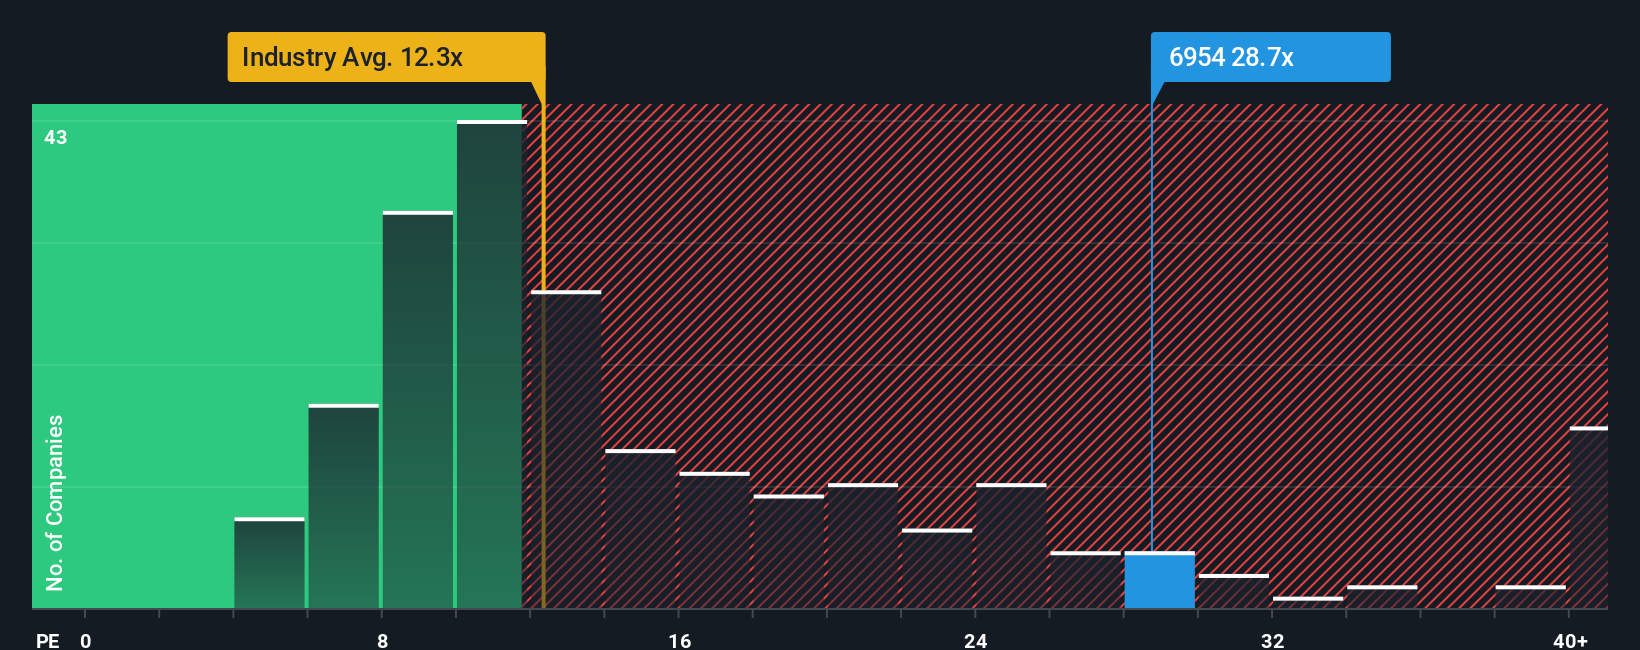
Fanuc currently trades at a PE ratio of 26.87x. This stands above the Machinery industry average of 13.43x and the peer average of 23.36x. However, comparing to these benchmarks only tells part of the story. Simply Wall St's proprietary "Fair Ratio," calculated at 23.24x for Fanuc, considers not just peers or industry trends but also the company’s specific earnings growth, risk profile, profit margin, and market cap. This holistic approach gives a more rounded perspective than simply relying on direct comparisons.
With Fanuc’s actual PE ratio at 26.87x and its Fair Ratio at 23.24x, the stock appears somewhat overvalued using this approach.
Result: OVERVALUED
PE ratios tell one story, but what if the real opportunity lies elsewhere? Discover companies where insiders are betting big on explosive growth.
Upgrade Your Decision Making: Choose your Fanuc Narrative
Earlier we mentioned that there's an even better way to understand valuation, so let's introduce you to Narratives. A Narrative is your unique perspective, a story you create about a company that connects what you believe will happen to Fanuc’s revenue, profits, and margins with your own estimate of its fair value.
This approach goes beyond static metrics and links a company’s story to a clear financial forecast, then directly to a fair value. This gives more meaning to the data. Narratives are easy to build and use, and are available right now on Simply Wall St's Community page, where millions of investors share their insights.
Narratives also help you make timely buy or sell decisions by letting you compare your Fair Value with Fanuc’s current Price. In addition, they update automatically when major news or earnings reports are released. For example, two investors could see Fanuc’s outlook very differently: one might expect rapid automation growth and set a high fair value, while another might worry about slowing demand and choose a far lower value.
Do you think there's more to the story for Fanuc? Create your own Narrative to let the Community know!
This article by Simply Wall St is general in nature. We provide commentary based on historical data and analyst forecasts only using an unbiased methodology and our articles are not intended to be financial advice. It does not constitute a recommendation to buy or sell any stock, and does not take account of your objectives, or your financial situation. We aim to bring you long-term focused analysis driven by fundamental data. Note that our analysis may not factor in the latest price-sensitive company announcements or qualitative material. Simply Wall St has no position in any stocks mentioned.
Have feedback on this article? Concerned about the content? Get in touch with us directly. Alternatively, email editorial-team@simplywallst.com