
How Will CGI’s Recent Stock Decline Shape Its Investment Appeal in 2025?
Trying to decide what to do with CGI stock? You’re far from alone. Right now, investors are weighing not just where the price sits today, but whether recent moves are hinting at something bigger. CGI has seen plenty of action over the last year, swinging down 17.4% over twelve months, but let’s not forget it’s still up an impressive 23.3% over three years and more than 40% across five. In the very short term, there’s been modest growth, with the last week alone seeing a 2.7% gain. This possibly reflects renewed optimism as some market jitters faded and wider industry trends steadied. However, the stock remains down year-to-date and over the past month, which often signals shifting investor sentiment or a re-evaluation of risk.
What’s really catching my eye isn’t just how CGI has moved, but how undervalued it looks according to six different valuation checks, achieving a perfect value score of 6. That’s not something you see every day. The next question, of course, is how these numbers hold up under the microscope of different valuation models. Let’s dive into those methods. At the end, I’ll share a perspective on valuation that could change the way you view CGI altogether.
Approach 1: CGI Discounted Cash Flow (DCF) Analysis
The Discounted Cash Flow (DCF) model estimates the value of a company by projecting its future free cash flows and bringing those back to today’s value, using a discount rate. This approach is widely used for its focus on a company’s actual ability to generate cash, not just accounting profits.
For CGI, the DCF uses a 2 Stage Free Cash Flow to Equity method with all figures in CA$. Over the last twelve months, CGI produced free cash flow of CA$1.79 billion, and analyst estimates suggest this will continue to rise. In fact, by 2027, free cash flow is expected to increase to CA$2.26 billion, with projections reaching over CA$2.93 billion in 2035. While analysts offer detailed forecasts for the next five years, cash flow beyond that is estimated using modest growth rates to keep projections reasonable.
According to these discounted projections, CGI’s intrinsic value lands at CA$185.66 per share. That represents a 31.5% discount from where the stock is trading now, which may indicate the stock is undervalued based on cash flow fundamentals.
Result: UNDERVALUED
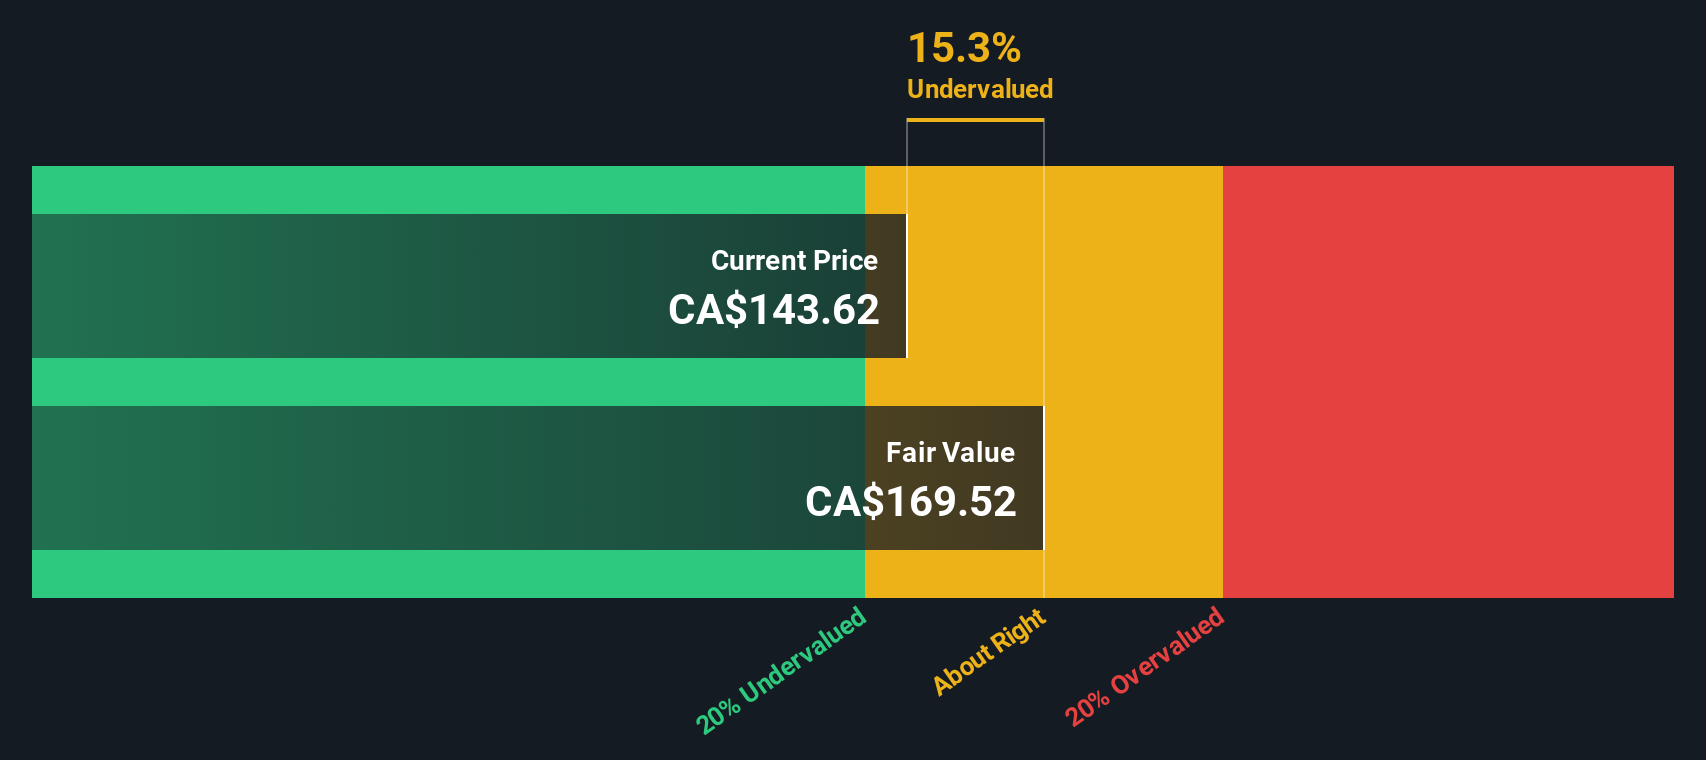
Our Discounted Cash Flow (DCF) analysis suggests CGI is undervalued by 31.5%. Track this in your watchlist or portfolio, or discover more undervalued stocks.
Approach 2: CGI Price vs Earnings
The Price-to-Earnings (PE) ratio is often the go-to metric for valuing profitable companies like CGI, as it directly relates the company’s share price to its bottom-line earnings. This makes it a quick yet powerful gauge for investors interested in understanding how much they are paying for each dollar of profit.
It’s important to remember that what counts as a “fair” PE ratio depends on expectations for future growth and the risks involved. In fast-growing businesses or those with solid, predictable profits, higher PE ratios are usually justified. Conversely, slower growers or riskier firms should trade at lower multiples.
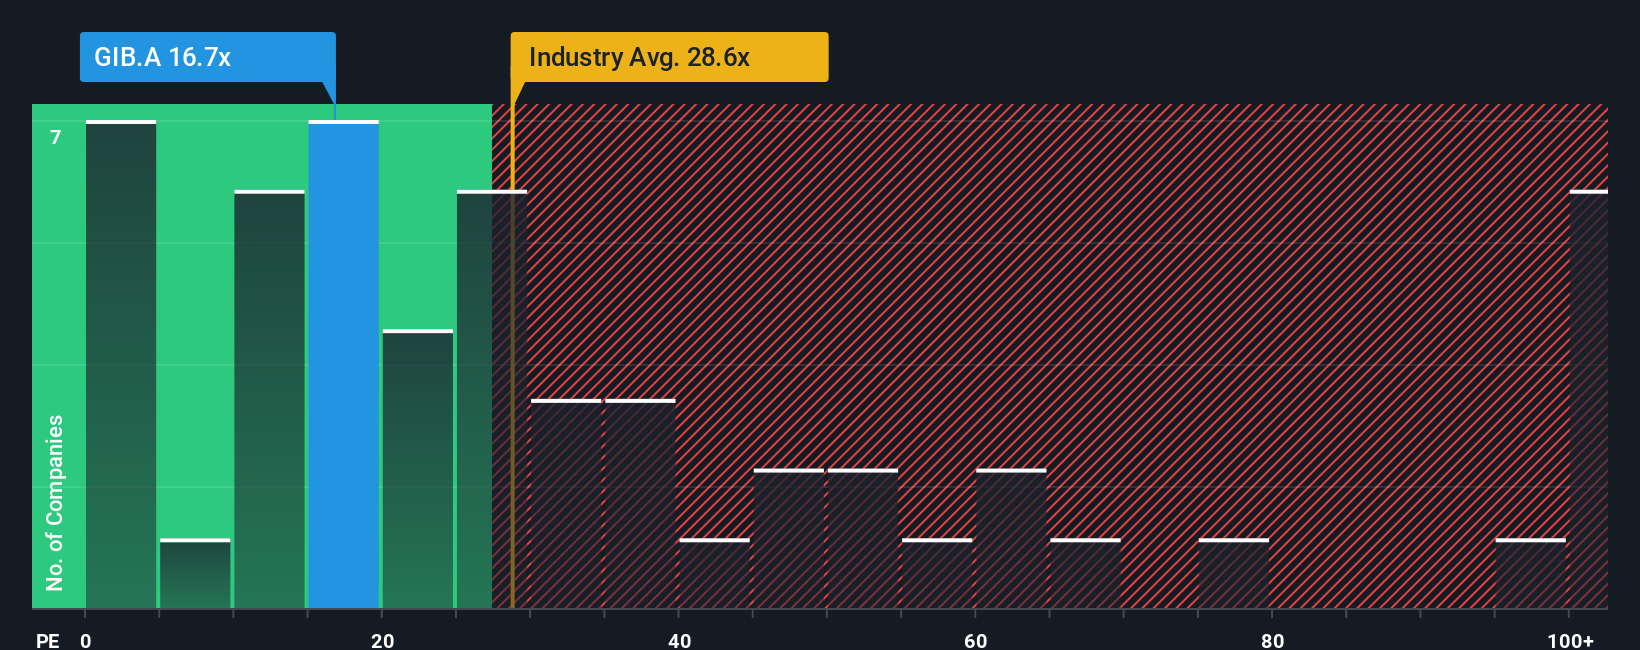
CGI currently trades at a PE ratio of 16.4x, which is comfortably below the IT industry average of 21.8x and much lower than peer companies averaging 63.8x. This suggests that, relative to the sector and competing firms, CGI may be valued conservatively at first glance.
However, the real benchmark to consider is Simply Wall St’s Fair Ratio, which blends CGI’s growth prospects, profit margins, industry, market cap and specific business risks. For CGI, this Fair Ratio sits at 32.2x, almost double its actual PE. The Fair Ratio sharpens the focus by factoring in details that broad industry and peer comparisons can miss, making it a more nuanced indicator of fair value.
Because CGI’s PE is much lower than its Fair Ratio, this suggests the stock is undervalued on an earnings basis right now.
Result: UNDERVALUED
PE ratios tell one story, but what if the real opportunity lies elsewhere? Discover companies where insiders are betting big on explosive growth.
Upgrade Your Decision Making: Choose your CGI Narrative
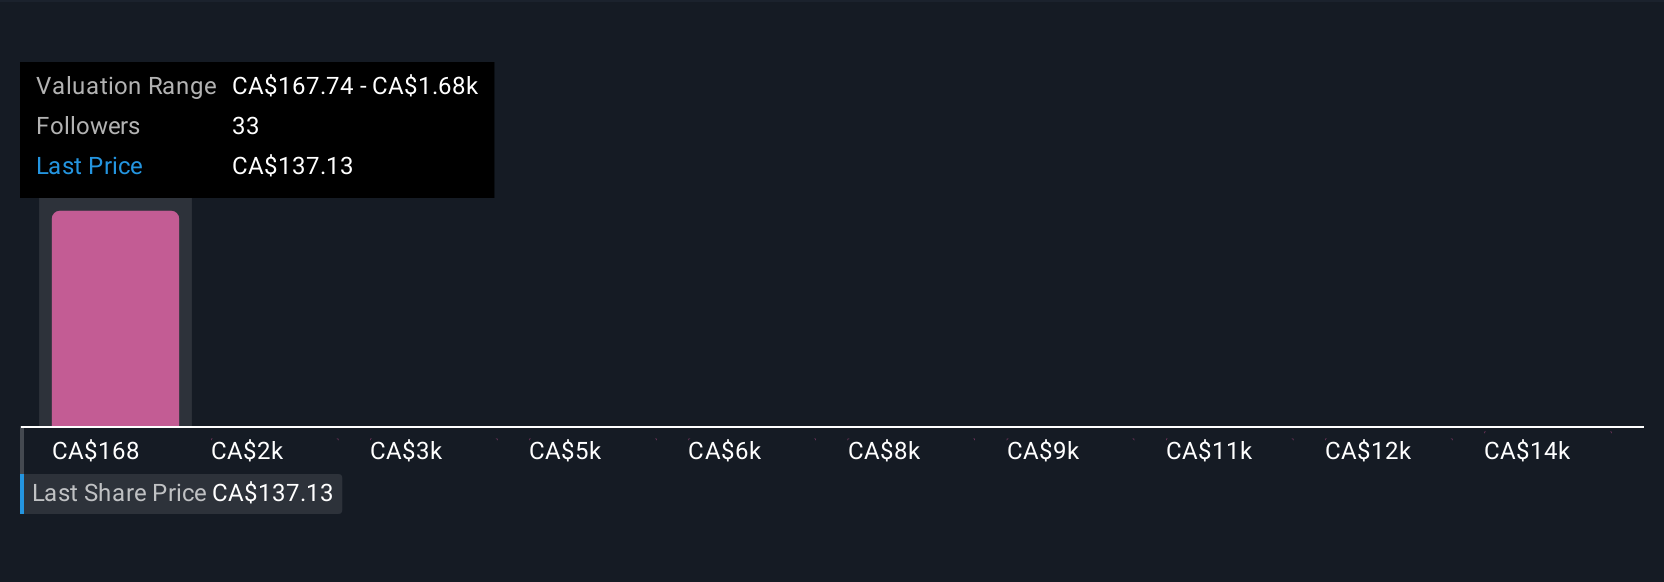
Earlier, we mentioned that there is an even better way to understand valuation. Let's introduce you to Narratives. Narratives are a simple yet powerful tool that let you build a story behind the numbers, connecting your unique perspective on CGI’s future with a personalized forecast of revenue, profit, and margins, and linking that story all the way to an estimated fair value for the stock.
With Narratives on Simply Wall St’s Community page, used by millions of investors, you can quickly align your investment view with the numbers that matter to you, adjusting assumptions based on what you believe will drive CGI’s performance. This tool makes it easy to compare the Fair Value generated by your Narrative to CGI’s real-time share price, making decisions about buying or selling much smarter and more transparent.
Narratives update automatically whenever new data, news, or earnings are released, so your story (and your fair value) always reflects the latest information. For example, one investor may set a bullish Narrative with tech-led growth and see a fair value as high as CA$185. Another might focus on competitive risks and use CA$137 as their target, showing how Narratives flexibly capture different beliefs and scenarios with just a few clicks.
Do you think there's more to the story for CGI? Create your own Narrative to let the Community know!
This article by Simply Wall St is general in nature. We provide commentary based on historical data and analyst forecasts only using an unbiased methodology and our articles are not intended to be financial advice. It does not constitute a recommendation to buy or sell any stock, and does not take account of your objectives, or your financial situation. We aim to bring you long-term focused analysis driven by fundamental data. Note that our analysis may not factor in the latest price-sensitive company announcements or qualitative material. Simply Wall St has no position in any stocks mentioned.
Have feedback on this article? Concerned about the content? Get in touch with us directly. Alternatively, email editorial-team@simplywallst.com