
- PREMIUM
- LIVE QUOTES
- INSTITUTIONS
 Index Options
 State Street
 CME Group
 Nasdaq
 Cboe
Cboe TradingView
 Wall Street Journal
Has MP Materials Run Too Far After 17.9% Monthly Jump and New Rare Earths Supply Deals?
If you have spent any time watching MP Materials on your investing radar, you have probably noticed the incredible momentum in its stock price. After climbing 9.0% just in the last week and a stunning 17.9% over the past month, MP Materials is making waves. If you zoom out, the bigger picture is even more astonishing. Year to date, the company is up by 353.5%, boasting a 316.6% gain over the last year and more than quadrupling investors’ money across five years with a massive 419.1% return. Clearly, there is a lot to talk about when it comes to MP Materials, especially as rare earths and critical minerals continue to make headlines as strategic assets for tech and energy transitions.
Why is the market so excited? Shifts in global supply chains and an increased focus on securing domestic sources for rare earths have been front and center. MP Materials often finds itself in the spotlight because of these larger trends. As investors try to decipher whether this stock is a momentum play or still has room to run, it is tough not to wonder if the explosive run-up means the valuation is stretched or if the story is just getting started.
Here comes the catch: based on the usual valuation checks, MP Materials scores a 0 out of 6 for being undervalued. Not one metric flashes the green light. But as any seasoned investor knows, valuation gets a lot more interesting when you dig deeper than the surface. Next, let’s break down each valuation method and see what they really tell us about MP Materials. Sometimes, a fresh perspective adds even more value to the discussion.
MP Materials scores just 0/6 on our valuation checks. See what other red flags we found in the full valuation breakdown.
Approach 1: MP Materials Discounted Cash Flow (DCF) Analysis
The Discounted Cash Flow (DCF) model projects a company’s expected future cash flows and then discounts those back to today’s value to estimate what the business is really worth right now. For MP Materials, analysts use a two-stage Free Cash Flow to Equity approach, capturing both short-term forecasts and longer-term growth probabilities.
Currently, MP Materials is generating negative Free Cash Flow, at around -$260.5 million, reflecting an ongoing investment phase. Looking ahead, forecasts suggest this will flip positive in the coming years, with analyst estimates as far out as 2027 predicting Free Cash Flow of $24.5 million. Beyond that point, projections are extrapolated and show significant growth. By 2035, the estimated Free Cash Flow reaches about $164 million. All figures are reported in US dollars.
After applying the DCF model, the intrinsic value per share is calculated at $12.90. Compared to the current share price, this implies MP Materials is 476.2% overvalued based on these cash flow projections. While this does not mean the business lacks growth potential, it highlights that a lot of optimism is already priced in.
Result: OVERVALUED
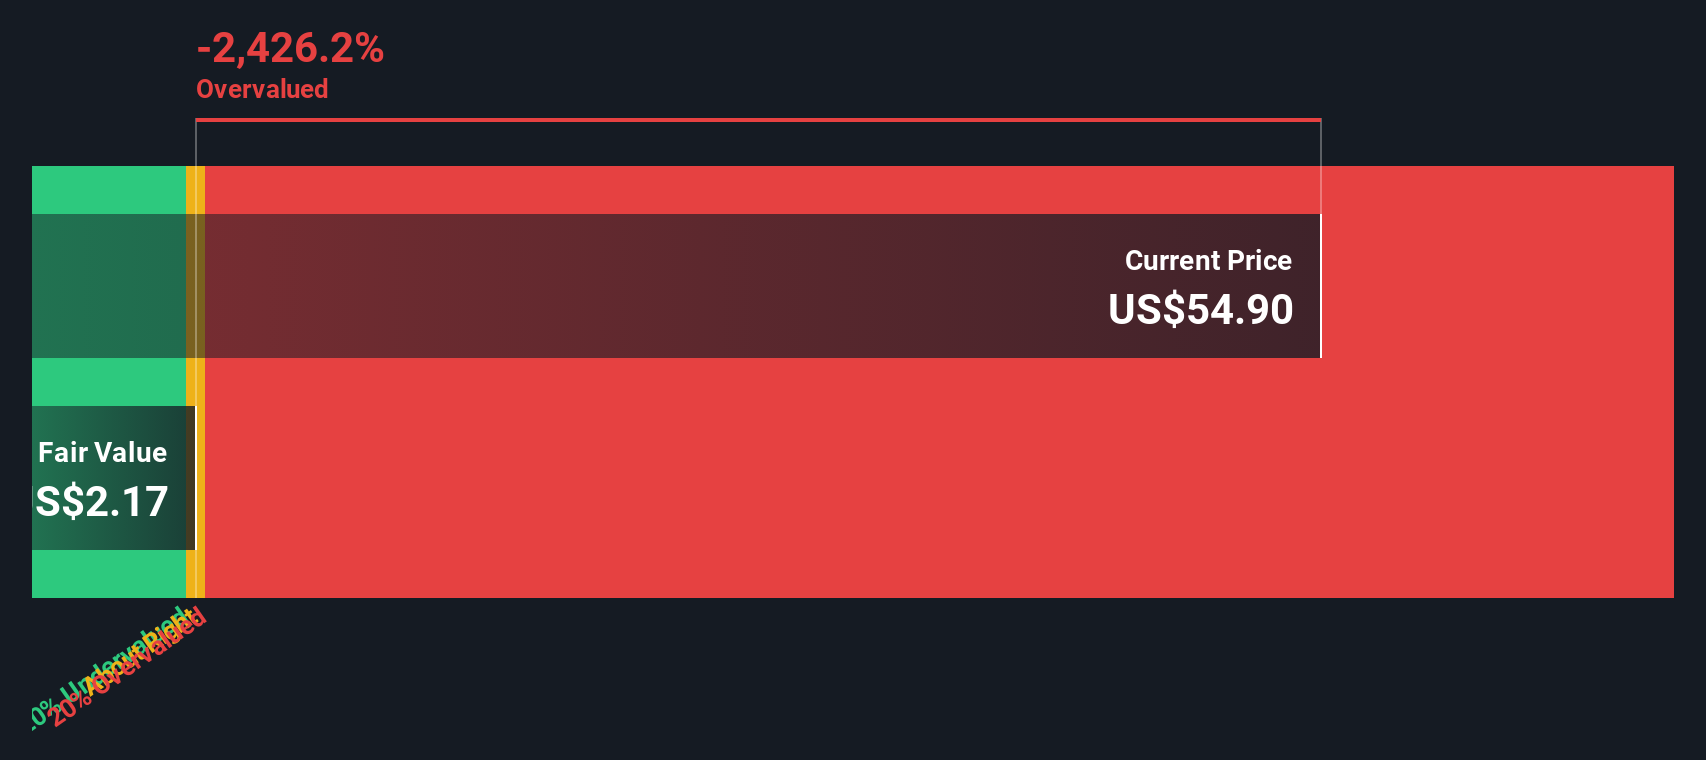
Our Discounted Cash Flow (DCF) analysis suggests MP Materials may be overvalued by 476.2%. Find undervalued stocks or create your own screener to find better value opportunities.
Approach 2: MP Materials Price vs Book
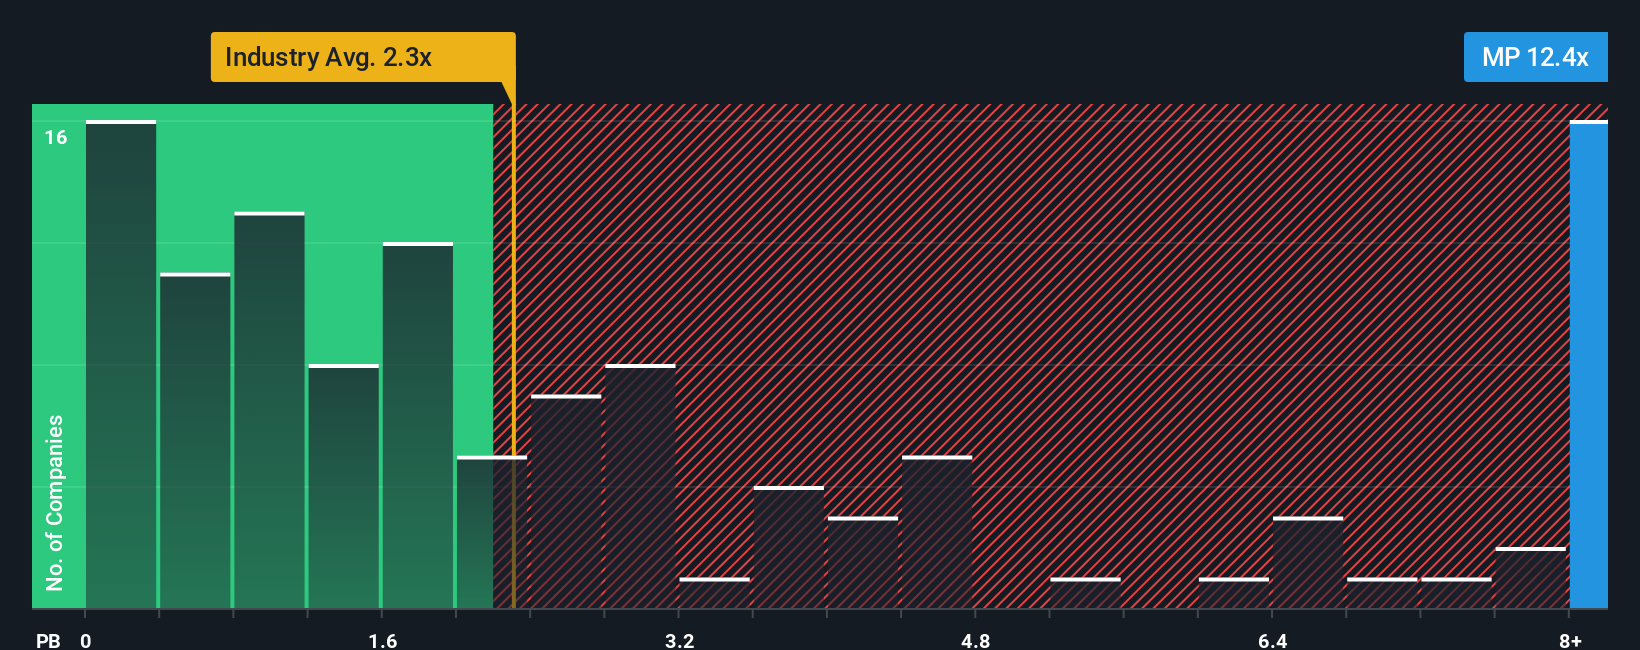
When evaluating companies like MP Materials, the Price-to-Book (P/B) ratio is often seen as a reliable benchmark, especially in asset-heavy sectors such as metals and mining. This metric compares the market value of a company to the book value of its assets. It is an effective way to gauge whether a stock is trading above or below what its assets might justify for companies that are still building profitability or experiencing earnings volatility.
Growth expectations and risk play a big part in what constitutes a fair P/B ratio. Higher expected growth or lower perceived risk usually justifies a higher multiple, whereas stagnant or shrinking companies should command a lower one. As of now, MP Materials trades at a P/B of 13.03x, which stands out not just against the metals and mining industry average of 2.38x, but even against peers at 11.97x.
To get a more nuanced view, Simply Wall St uses the Fair Ratio, a proprietary metric that predicts what the company’s P/B should be considering its unique mix of growth prospects, profitability, industry norms, and risk factors. Unlike simple peer or industry averages, this model accounts for factors such as MP’s market cap, expected growth rate, risk profile, and its operating margins. When compared to the actual 13.03x multiple, this tailored Fair Ratio perspective helps to cut through the noise and see if the stock is truly overvalued or just reflecting justified optimism.
Result: OVERVALUED
PB ratios tell one story, but what if the real opportunity lies elsewhere? Discover companies where insiders are betting big on explosive growth.
Upgrade Your Decision Making: Choose your MP Materials Narrative
Earlier we mentioned that there's an even better way to understand valuation, so let's introduce you to Narratives. A Narrative is simply your informed story about a company, where you outline the reasons behind your assumptions for fair value, as well as your personal forecasts for future revenue, earnings, and margins. Instead of relying solely on static ratios, Narratives connect the dots from MP Materials’ business story to your own financial model, and finally to what you believe is a justified share price.
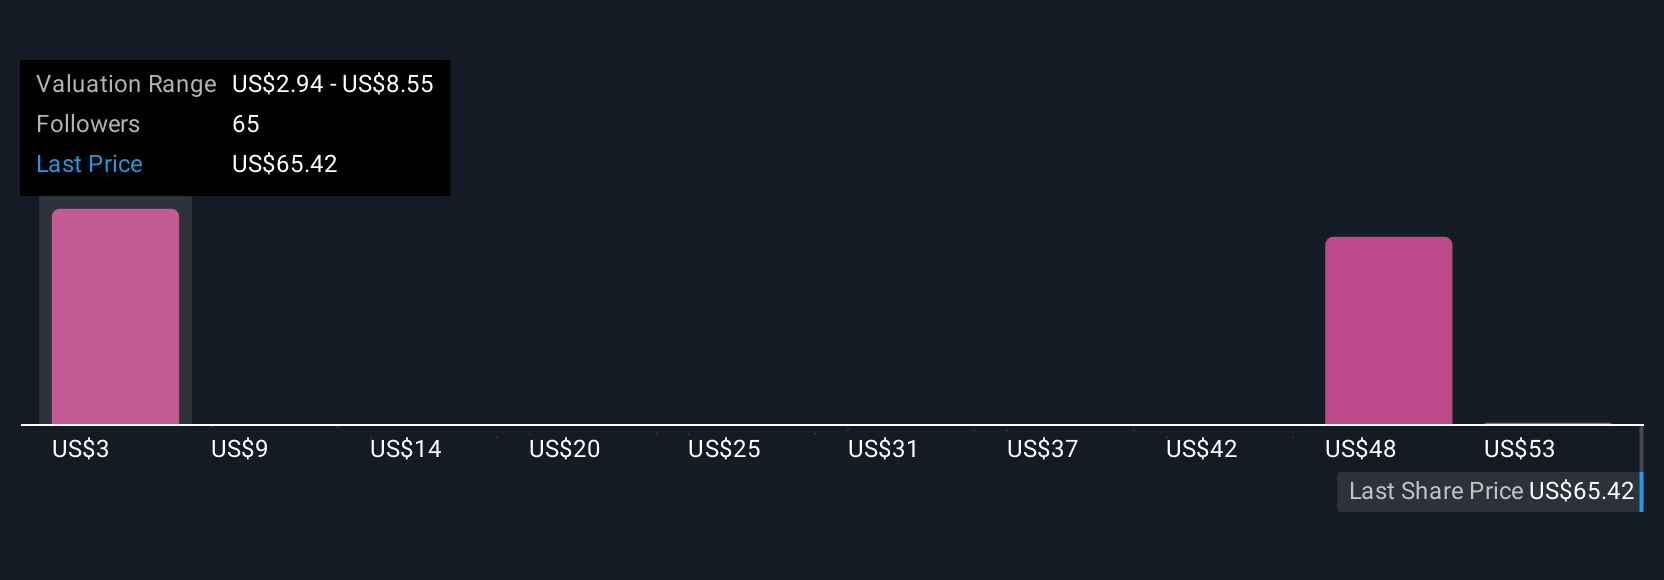
On Simply Wall St’s Community page, millions of investors are already building and sharing their Narratives, making it easy for anyone to express their view, update it as new facts emerge, and see how their perspective compares to others. Narratives show you at a glance when your Fair Value estimate signals “buy” or “sell,” by constantly updating alongside news, earnings, and company developments. For example, one investor might highlight bullish government contracts and Apple partnerships to justify a fair value of $85, while a more cautious view might focus on risks and estimate just $65. This shows how different outlooks can coexist and helps you make smarter, story-driven decisions of your own.
Do you think there's more to the story for MP Materials? Create your own Narrative to let the Community know!
This article by Simply Wall St is general in nature. We provide commentary based on historical data and analyst forecasts only using an unbiased methodology and our articles are not intended to be financial advice. It does not constitute a recommendation to buy or sell any stock, and does not take account of your objectives, or your financial situation. We aim to bring you long-term focused analysis driven by fundamental data. Note that our analysis may not factor in the latest price-sensitive company announcements or qualitative material. Simply Wall St has no position in any stocks mentioned.
Have feedback on this article? Concerned about the content? Get in touch with us directly. Alternatively, email editorial-team@simplywallst.com