
- PREMIUM
- LIVE QUOTES
- INSTITUTIONS
 Index Options
 State Street
 CME Group
 Nasdaq
 Cboe
Cboe TradingView
 Wall Street Journal
How BCE’s Stock Stands After Recent Layoffs and Dividend Cut in 2025
If you’re wondering what to do with BCE stock, you’re definitely not alone. It’s a question plenty of investors are wrestling with these days, and for good reason. The last year has been challenging for BCE, with the share price dropping 22.4%. Even stretching back five years, the stock is down 17.6%. On the flip side, there are hints that things may be turning. In just the past seven days, BCE has managed a modest gain of 0.6%. That tiny bounce has caught the eye of value hunters, especially as market sentiment around large telecoms and utilities starts to shift in the face of rising interest rates and evolving competition.
When looking at the numbers, BCE’s value score comes in at 2. In our system, that means it passes 2 out of 6 key valuation checks for being undervalued. That’s not a screaming buy, but it does suggest there are some glimmers of opportunity worthy of a closer look. This may be particularly relevant if you’re focused on the long term and not just short-term price swings.
So, is BCE fairly priced, overvalued, or quietly waiting to reward patient investors? In the next section, we’ll break down exactly how BCE stacks up across the most important valuation yardsticks and reveal a smarter, more comprehensive way to chart a company’s true value that goes beyond any single metric.
BCE scores just 2/6 on our valuation checks. See what other red flags we found in the full valuation breakdown.
Approach 1: BCE Discounted Cash Flow (DCF) Analysis
A Discounted Cash Flow (DCF) model estimates the value of a company by projecting its future cash flows and discounting them back to today, reflecting the time value of money. This process provides a data-driven way of evaluating whether a stock is trading above or below its intrinsic value.
For BCE, the current Free Cash Flow (FCF) stands at CA$2.71 Billion. Analysts provide cash flow estimates up to about 5 years out; after this period, further projections are extrapolated. By 2027, BCE’s FCF is expected to rise to around CA$3.80 Billion. Over a ten-year horizon, these projections continue to climb, based largely on gradual annual increases.
Using the Two-Stage Free Cash Flow to Equity DCF model, the intrinsic value for BCE is estimated at CA$117.22 per share. This result suggests a sizeable discount, meaning the current share price is roughly 72.2% below what the model considers fair value.
In summary, the DCF valuation presents BCE as meaningfully undervalued compared to its future cash flow potential.
Result: UNDERVALUED
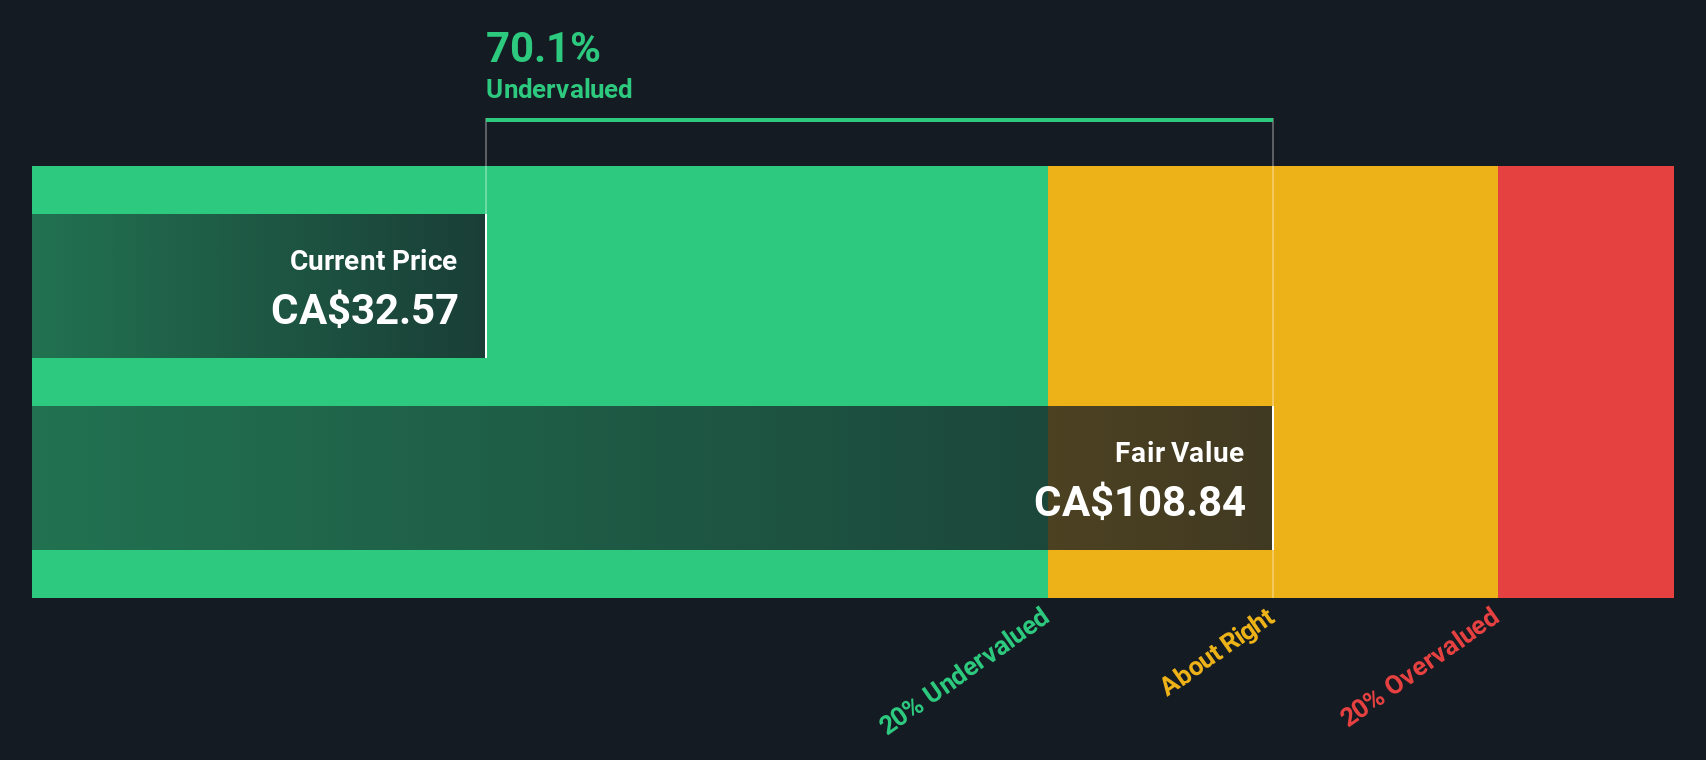
Our Discounted Cash Flow (DCF) analysis suggests BCE is undervalued by 72.2%. Track this in your watchlist or portfolio, or discover more undervalued stocks.
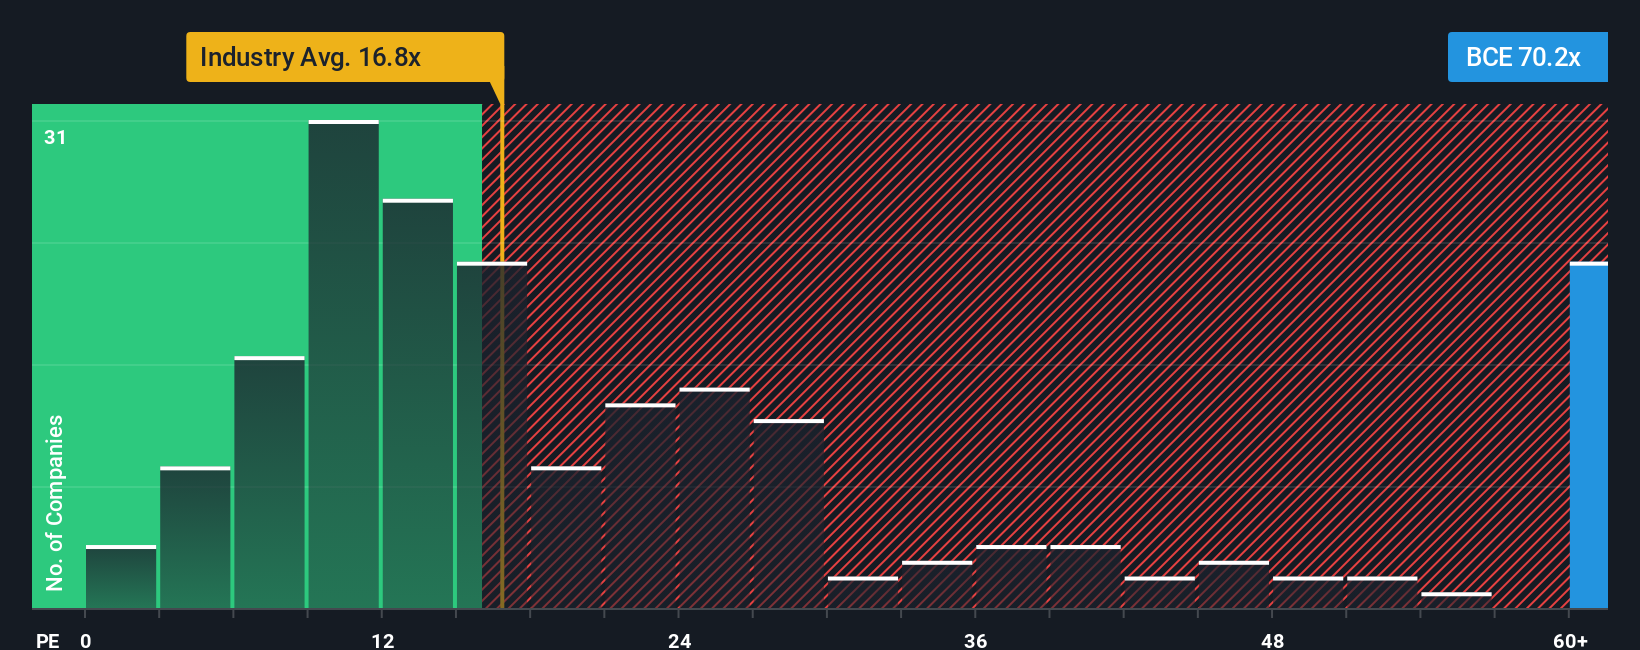
Approach 2: BCE Price vs Earnings
The Price-to-Earnings (PE) ratio is a standard yardstick for valuing profitable companies like BCE. It helps investors assess how much they are paying for each dollar of current earnings. A “normal” or “fair” PE ratio depends on the broader risk and growth outlooks. Companies with higher expected earnings growth or lower risk might justify higher PE multiples, whereas slower growing or riskier companies tend to deserve a discount.
Right now, BCE trades at a PE ratio of 70.2x. For context, the typical peer averages just 15.8x, and the broader telecom industry comes in at 17.0x. At first glance, BCE’s PE appears far higher than these benchmarks. However, raw multiples do not always tell the full story, since different companies face different growth trajectories, profit margins, and risk profiles.
This is where the Simply Wall St "Fair Ratio" comes in. Our Fair Ratio for BCE sits at 20.0x, calculated to reflect the company’s unique profile: its expected growth, profitability, sector characteristics, and market cap. This approach is more holistic than a simple peer or industry comparison, since it accounts for all the relevant variables that can justify a premium or discount.
Comparing BCE’s current PE of 70.2x to the Fair Ratio of 20.0x suggests the shares are significantly overvalued on this metric. This implies the market is pricing in ambitious expectations that may be tough to meet without a strong rebound in profits.
Result: OVERVALUED
PE ratios tell one story, but what if the real opportunity lies elsewhere? Discover companies where insiders are betting big on explosive growth.
Upgrade Your Decision Making: Choose your BCE Narrative
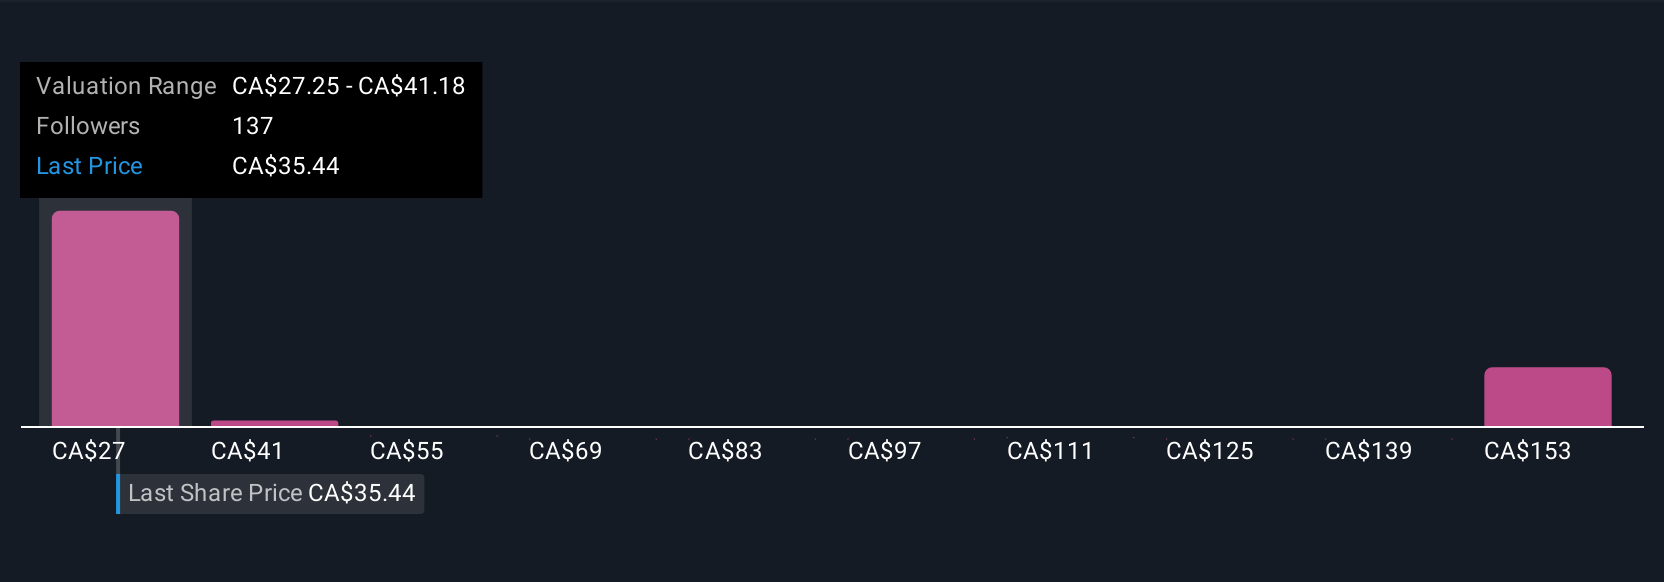
Earlier we mentioned that there's an even better way to understand valuation, so let's introduce you to Narratives. A Narrative is a clear, personalized story you can build around a company by combining your assumptions about future growth, earnings, and margins into a meaningful financial forecast and an estimated fair value. Narratives put the company’s big picture and your unique perspective at the center, helping you see how your outlook translates into practical numbers and investment decisions.
On Simply Wall St’s Community page, millions of investors use Narratives to connect the numbers to real insights and track how changes such as news or earnings updates might affect a company's value. Narratives empower you to compare the fair value from your story to BCE’s live price, guiding smarter buy or sell decisions that reflect what you believe, not just what the market says.
For example, one community member might believe BCE’s investment in fiber networks and AI will drive sustained growth, projecting a fair value as high as CA$45.0 per share. Another might be more cautious, worried about regulatory and competitive risks, and set their fair value at just CA$30.0. Narratives let you test these perspectives, keep them up to date, and invest with more confidence based on your own best information.
Do you think there's more to the story for BCE? Create your own Narrative to let the Community know!
This article by Simply Wall St is general in nature. We provide commentary based on historical data and analyst forecasts only using an unbiased methodology and our articles are not intended to be financial advice. It does not constitute a recommendation to buy or sell any stock, and does not take account of your objectives, or your financial situation. We aim to bring you long-term focused analysis driven by fundamental data. Note that our analysis may not factor in the latest price-sensitive company announcements or qualitative material. Simply Wall St has no position in any stocks mentioned.
Have feedback on this article? Concerned about the content? Get in touch with us directly. Alternatively, email editorial-team@simplywallst.com