
Does Flex Have Room to Run After 45% Rally and Manufacturing Tailwinds in 2025?
If you are eyeing Flex and wondering whether its recent run still leaves room for upside, you are not alone. After a huge multi-year rally, with shares up over 535.6% in five years and 335.2% in just the last three, Flex has certainly rewarded patient investors. Even this year, the stock is up a remarkable 45.3% year-to-date, although the last week was choppy with a -1.3% slip. The past month saw a slight gain of 0.8%, hinting at market uncertainty as investors sort through what’s next for the company.
A lot of the recent momentum ties back to shifting sentiment toward sectors where Flex operates, thanks to market developments boosting optimism around manufacturing and supply chain innovation. What is interesting is the sense that the market may be reassessing Flex’s risk, with longer-term growth now pricing in a blend of both opportunity and caution.
Of course, before making a move, you want to know if Flex is actually undervalued, and the numbers offer some intriguing clues. Based on six key valuation checks, Flex scores a 4, meaning it screens as undervalued in four out of six major ways analysts assess a stock. But how do these individual valuation approaches work, and which ones matter most for Flex?
Let’s dig into the details of those valuation methods, and stay tuned for an even better way to think about Flex’s worth by the end of this article.
Approach 1: Flex Discounted Cash Flow (DCF) Analysis
The Discounted Cash Flow (DCF) model estimates what a company’s stock should be worth today by projecting all its future cash flows and then discounting those amounts back to the present using a reasonable rate. This approach looks beyond earnings or book value and focuses instead on how much cash the business can actually produce for shareholders over time.
For Flex, the most recent reported Free Cash Flow stands at $1.03 billion, forming the base for the model. Analyst forecasts cover growth over the next five years, and projections extend out another five years through careful extrapolation. By 2028, Free Cash Flow is expected to reach $1.27 billion, and by 2035, the projection grows to $1.66 billion. Each of these future values is discounted back to today’s dollars to create an estimate of the present business value.
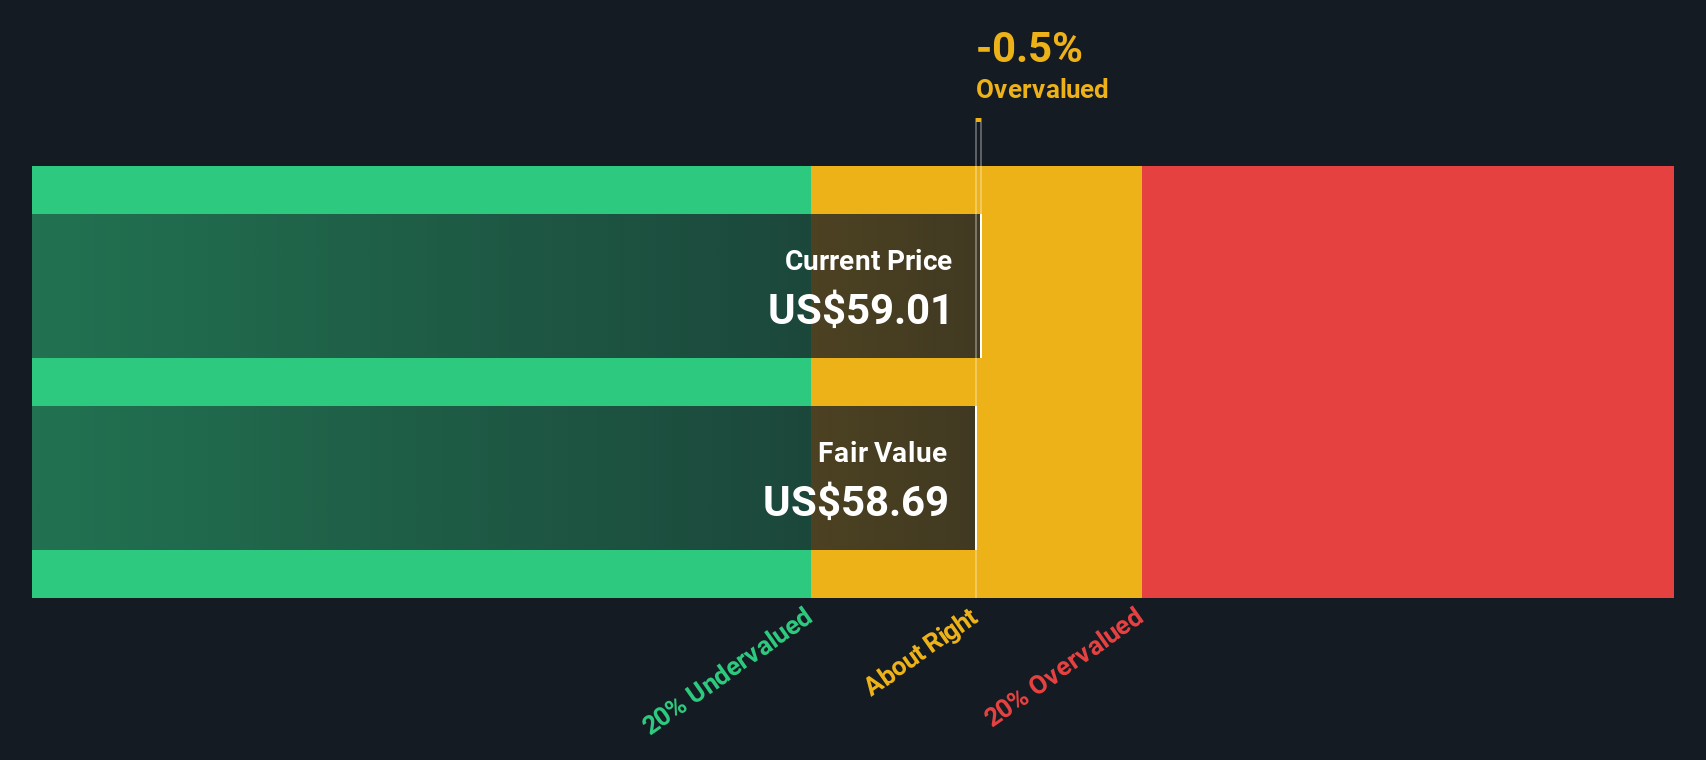
The result is that Flex’s intrinsic value using this DCF approach is calculated at $57.86 per share. This is roughly 3.0% higher than where shares currently trade, suggesting only a slight undervaluation at these levels.
Result: ABOUT RIGHT
Simply Wall St performs a valuation analysis on every stock in the world every day (check out Flex's valuation analysis). We show the entire calculation in full. You can track the result in your watchlist or portfolio and be alerted when this changes.
Approach 2: Flex Price vs Earnings (PE)
The Price-to-Earnings (PE) multiple is a go-to valuation metric for profitable companies like Flex because it relates the company's current share price to its bottom-line earnings. This makes it a solid tool for evaluating whether a stock’s valuation is reasonable relative to both its own profits and to competitors in the same industry.
Growth expectations play a big part in determining a “normal” or “fair” PE ratio. Investors are often willing to pay a higher PE for companies expected to deliver stronger earnings growth or to weather risks better than peers. On the other hand, elevated risks or slower growth prospects can justify a lower PE.
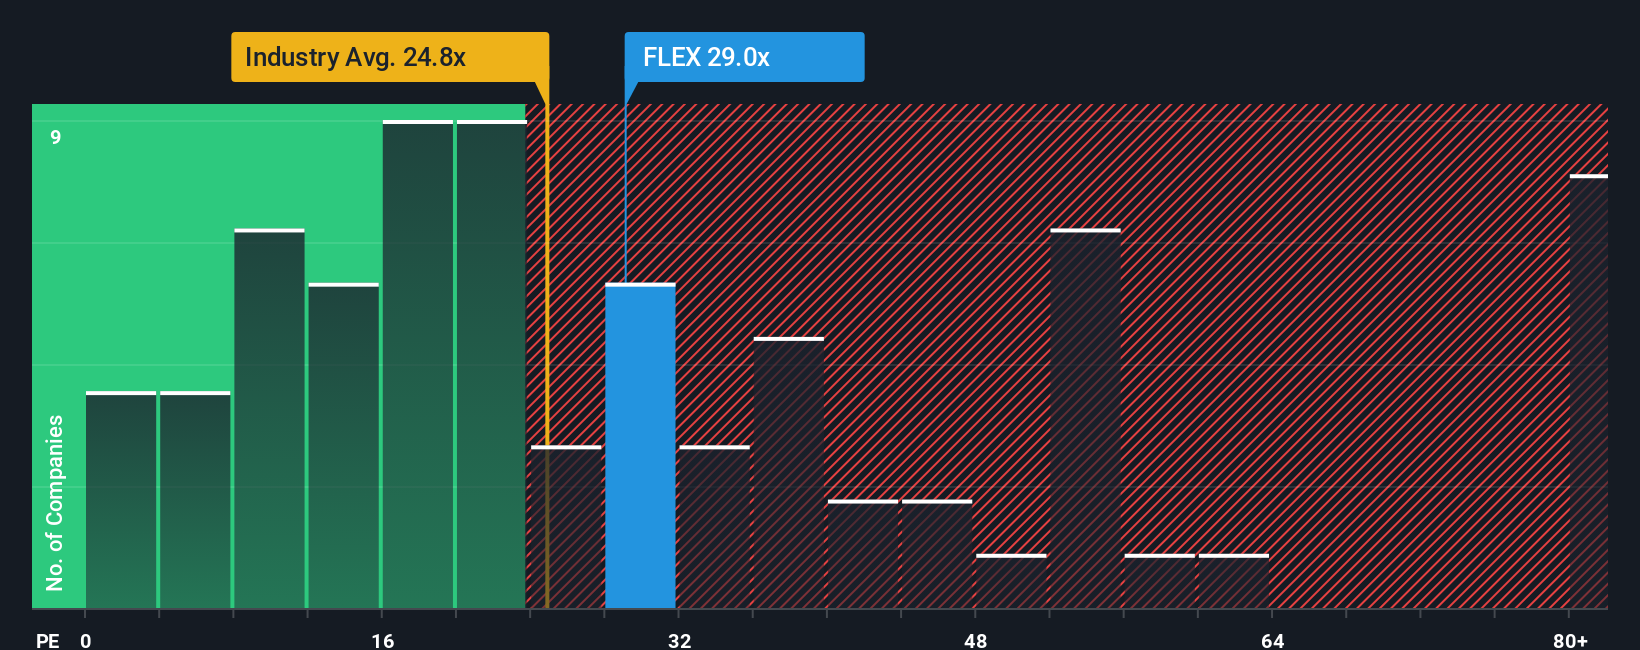
Flex currently trades on a PE of 23.6x, which is almost in line with the electronics industry average of 24.0x and below the peer average of 35.2x. To get a sharper picture, Simply Wall St calculates a proprietary “Fair Ratio” for Flex, based not just on peer and industry averages but also on key drivers like profit margins, future growth, risk profile, and market cap. In Flex’s case, the Fair Ratio is 32.0x, providing a more tailored benchmark than a simple market average.
Considering that Flex’s current PE multiple is noticeably below its Fair Ratio, the numbers point to Flex being undervalued on an earnings multiple basis.
Result: UNDERVALUED
PE ratios tell one story, but what if the real opportunity lies elsewhere? Discover companies where insiders are betting big on explosive growth.
Upgrade Your Decision Making: Choose your Flex Narrative
Earlier we mentioned there's an even better way to understand valuation, so let's introduce you to Narratives. A Narrative is your story about a company: the reasons you believe it will succeed or struggle, along with your assumptions about its future growth and profitability. Narratives connect what you know and believe about Flex to a financial forecast, so you can see how your expectations translate into a fair value. With Simply Wall St’s Narratives tool (available on the Community page and used by millions), it’s easy to map out your investment thesis and instantly compare your derived fair value with today’s market price to decide if Flex fits your strategy.
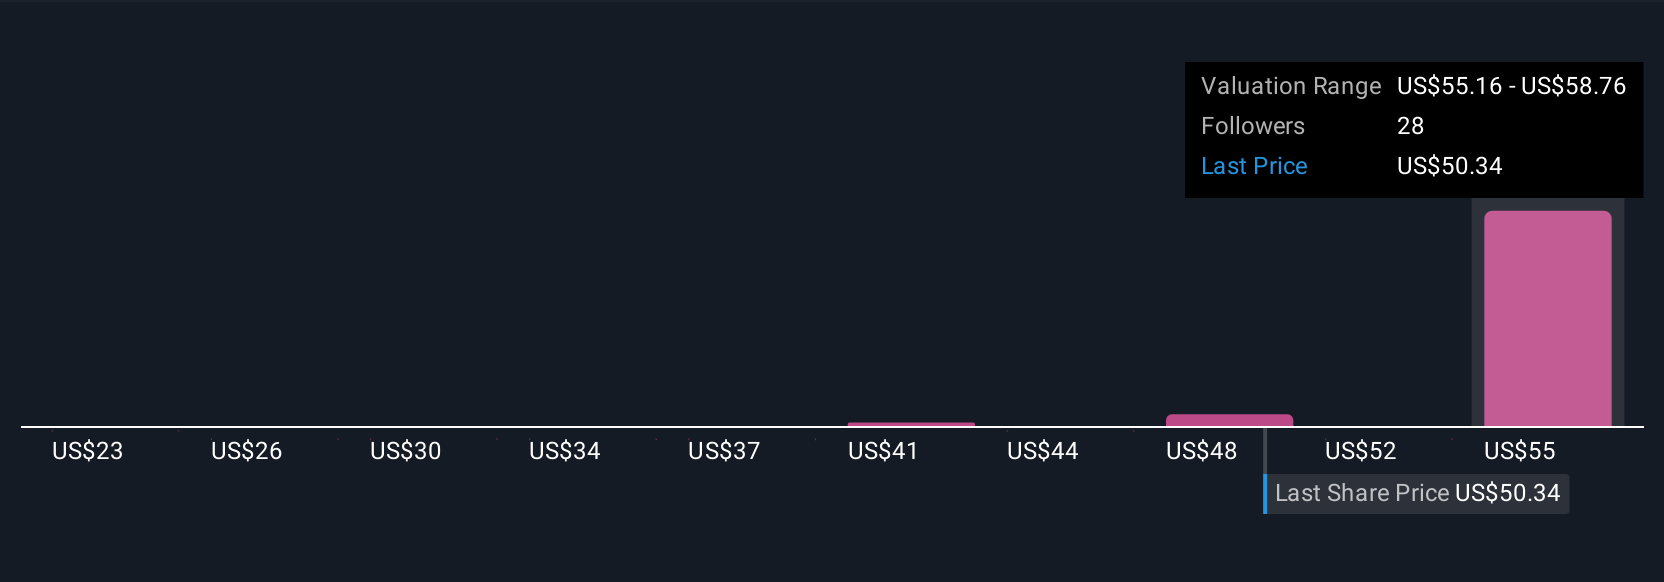
What makes Narratives so powerful is that they update automatically when new information, like fresh earnings or breaking news, becomes available so your outlook stays relevant without you lifting a finger. For example, some investors looking at Flex may feel bullish, projecting future earnings and profit margins to justify a fair value closer to $65 per share; others are more cautious, using conservative forecasts and arriving at a value around $50. Narratives let you see and refine your own perspective, supporting smarter, faster decisions tailored to your view of Flex’s future.
Do you think there's more to the story for Flex? Create your own Narrative to let the Community know!
This article by Simply Wall St is general in nature. We provide commentary based on historical data and analyst forecasts only using an unbiased methodology and our articles are not intended to be financial advice. It does not constitute a recommendation to buy or sell any stock, and does not take account of your objectives, or your financial situation. We aim to bring you long-term focused analysis driven by fundamental data. Note that our analysis may not factor in the latest price-sensitive company announcements or qualitative material. Simply Wall St has no position in any stocks mentioned.
Have feedback on this article? Concerned about the content? Get in touch with us directly. Alternatively, email editorial-team@simplywallst.com