
What Do Recent Price Swings Mean for Unity Software’s Real Value in 2025?
If you are weighing your next move on Unity Software stock, you are hardly alone. After a rollercoaster few years, Unity has landed right back in the spotlight, catching the attention of both risk-takers and long-haulers. The company’s shares recently pulled back, down 11.4% over the past week and 13.5% over the past month. That sounds harsh, but zoom out and you see a stock that’s still up 54.6% year-to-date and an eye-popping 73.5% in the past twelve months. This is quite a comeback story even with some turbulence along the way. Not everyone forgets that zooming out further, the 5-year return remains deep in the red at -61.8%, a reminder that big growth swings and risk reassessments have been part of the Unity journey from the start.
Price swings aside, what’s under the hood when it comes to value? According to an in-depth look at several standard valuation checks, Unity is currently scoring just a 1 out of 6, meaning it only passes one marker for being undervalued. Before you write it off or jump in, let’s dig into what these valuation scores really mean for Unity today, explore how different approaches help or hinder your analysis, and save the most insightful way to think about Unity’s value for last.
Unity Software scores just 1/6 on our valuation checks. See what other red flags we found in the full valuation breakdown.
Approach 1: Unity Software Discounted Cash Flow (DCF) Analysis
The Discounted Cash Flow (DCF) model estimates what a company is worth today by projecting its future cash flows and then discounting them back to the present. For Unity Software, this analysis looks at expected Free Cash Flow (FCF) using a 2 Stage Free Cash Flow to Equity approach.
Unity’s most recent annual Free Cash Flow sits at $337.4 Million. Analyst forecasts take this up to around $866 Million by 2029, with each forecasted year reflecting a consensus of varying analyst predictions. These projections, while relying on expert estimates for the next five years, highlight a steady upward curve in Unity’s ability to generate cash. For years further out, Simply Wall St has extrapolated FCF growth, which should be treated as less certain but still illustrative of growth expectations.
Basing the valuation on these future cash flows, the DCF model arrives at an intrinsic value of $33.25 per share. However, when you compare this to Unity’s current trading price, the math suggests Unity stock is trading roughly 14% above its estimated fair value. In plain terms, the DCF model says the stock is currently overvalued based on these future projections.
Result: OVERVALUED
Our Discounted Cash Flow (DCF) analysis suggests Unity Software may be overvalued by 14.0%. Find undervalued stocks or create your own screener to find better value opportunities.
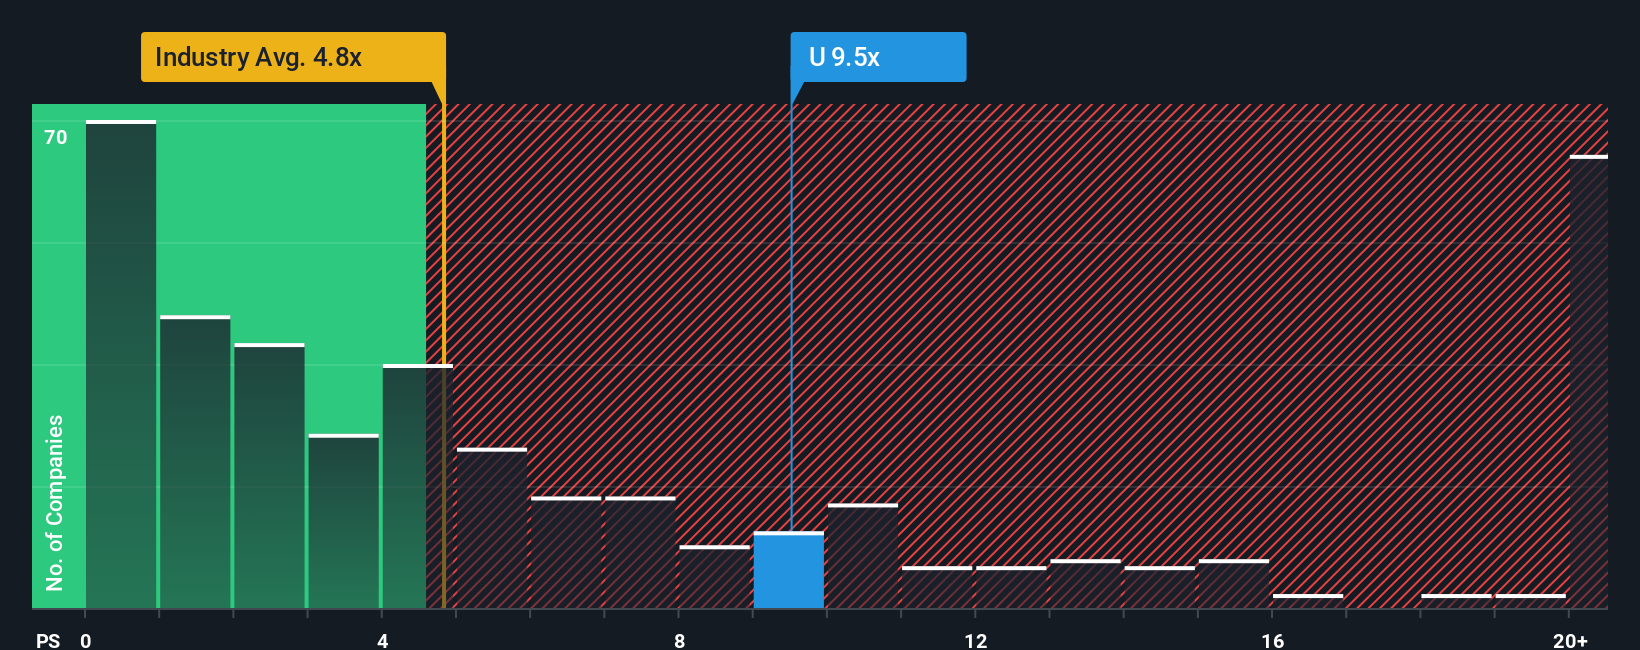
Approach 2: Unity Software Price vs Sales (P/S)
The Price-to-Sales (P/S) ratio is a popular valuation metric, especially for companies that are not consistently profitable or are investing heavily in growth. Unlike the Price-to-Earnings (P/E) ratio, which relies on positive earnings, the P/S ratio compares a company’s market value to its revenue. This makes it well suited for software businesses like Unity that may have fluctuating profits due to high development and growth spending.
Growth expectations and perceived risks play a major role in shaping what a "normal" or "fair" P/S ratio should be. High-growth tech companies often trade at higher P/S multiples because investors are willing to pay more in anticipation of rapid sales expansion. In contrast, riskier or slower-growing firms command a lower multiple.
At present, Unity Software is trading on a P/S ratio of 9x. This is above the broader Software industry average of 5.29x but below the peer average of 10.32x. However, these simple comparisons can be misleading since every company’s circumstances are unique. Simply Wall St’s “Fair Ratio” for Unity is currently 7.77x. The Fair Ratio is calculated using a proprietary algorithm that weighs not only growth rates and profitability, but also profit margins, market cap, business model, and industry-specific risks to provide a more tailored and accurate benchmark.
With Unity’s actual P/S ratio (9x) moderately above its Fair Ratio (7.77x), the implication is that the stock is trading somewhat on the expensive side from a price-to-sales standpoint.
Result: OVERVALUED
PS ratios tell one story, but what if the real opportunity lies elsewhere? Discover companies where insiders are betting big on explosive growth.
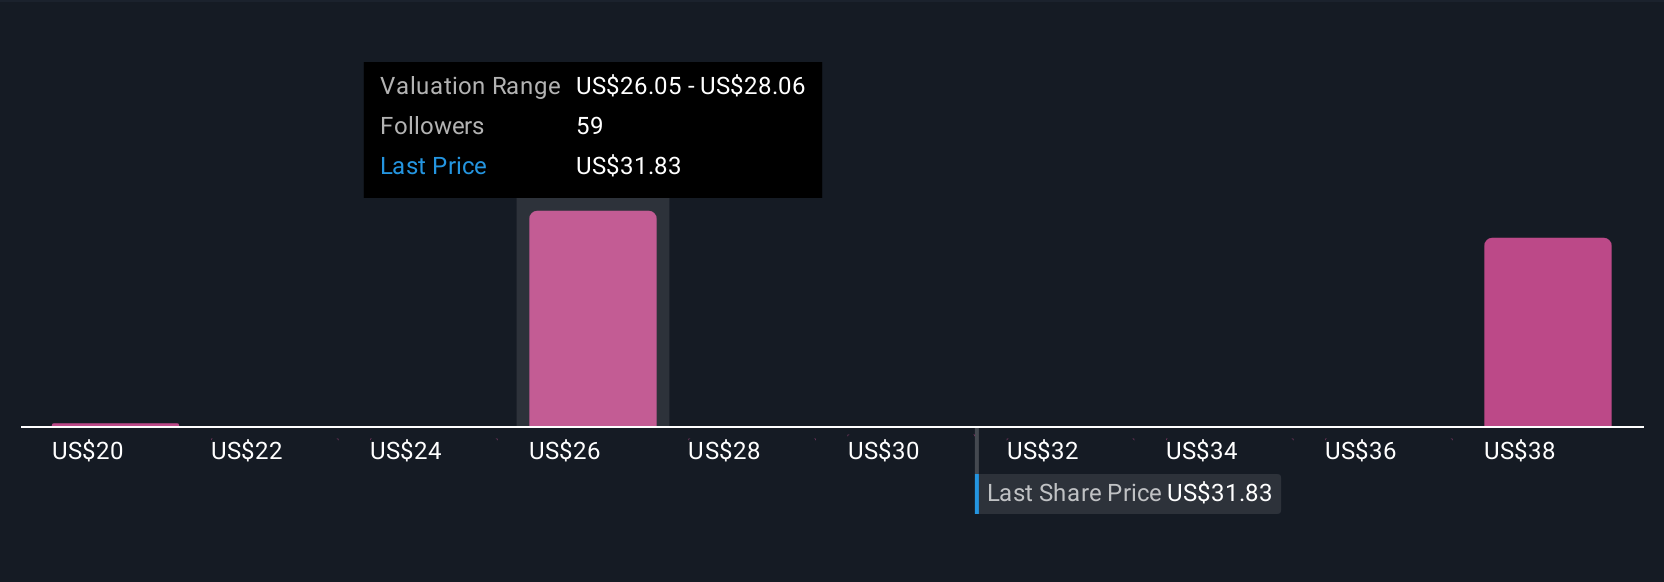
Upgrade Your Decision Making: Choose your Unity Software Narrative
Earlier we mentioned that there is an even better way to understand valuation, so let’s introduce you to Narratives. Rather than focusing solely on numbers and ratios, Narratives let you weave together your personal take on Unity Software’s business story, your assumptions about future revenue, earnings, margins, and fair value, and compare them against other investors. A Narrative links your perspective on Unity’s future to a financial forecast and a target price, offering a dynamic, story-driven approach to decision making.
Narratives are easy to use and accessible on Simply Wall St’s Community page, where millions of investors contribute their insights. By creating your own Narrative or exploring those shared by others, you can instantly see how your estimated fair value stacks up against Unity’s current price, helping you decide whether it’s the right time to buy, hold, or sell. Even better, these Narratives update automatically when new news or earnings change the outlook, making sure your analysis grows as Unity’s story evolves.
For example, one investor’s Narrative may highlight Unity’s strength in 3D content, emerging XR markets, and positive cash flow, with a fair value of $38.48 per share. Another, more cautious Narrative could focus on cost risks and market challenges, landing at a fair value of $18.00 per share. This allows you to compare and sense-check the stories that most closely match your view of Unity Software’s future.
For Unity Software, however, we'll make it really easy for you with previews of two leading Unity Software Narratives:
Fair Value: $38.48
Current Undervaluation: -1.5%
Revenue Growth Rate: 15%
- Unity remains a leader in 2D/3D content development, especially in mobile, indie games, and the XR market, with valuations near all-time lows.
- Diversification into non-gaming sectors and significant restructuring under new management strengthen the long-term growth outlook and financial stability.
- Synergy between Create and Grow solutions and positive cash flow position Unity for potential upside if its strategy executes successfully, despite competitive challenges.
Fair Value: $35.17
Current Overvaluation: 7.7%
Revenue Growth Rate: 9.4%
- Rapid AI-driven product innovation and expanding partnerships are driving revenue growth and improved margins, but aggressive spending and execution risks remain.
- Efforts to diversify revenue across industries and markets increase opportunity, yet customer concentration and regulatory or competitive challenges create potential volatility.
- Analyst consensus fair value is slightly below the current share price, indicating Unity may be overvalued unless growth and profitability targets are met.
Do you think there's more to the story for Unity Software? Create your own Narrative to let the Community know!
This article by Simply Wall St is general in nature. We provide commentary based on historical data and analyst forecasts only using an unbiased methodology and our articles are not intended to be financial advice. It does not constitute a recommendation to buy or sell any stock, and does not take account of your objectives, or your financial situation. We aim to bring you long-term focused analysis driven by fundamental data. Note that our analysis may not factor in the latest price-sensitive company announcements or qualitative material. Simply Wall St has no position in any stocks mentioned.
Have feedback on this article? Concerned about the content? Get in touch with us directly. Alternatively, email editorial-team@simplywallst.com