
- PREMIUM
- LIVE QUOTES
- INSTITUTIONS
 Index Options
 State Street
 CME Group
 Nasdaq
 Cboe
Cboe TradingView
 Wall Street Journal
Does Brown & Brown’s Recent Jump Signal More Growth Ahead in 2025?
If you have been wrestling with what to do about Brown & Brown stock lately, you are not alone. Many investors are taking a fresh look at this insurance broker, especially with its price performance sending some mixed signals. In the last week, Brown & Brown actually edged up by 1.2%, but if you pull back to the bigger picture, you will see it is down 0.4% in the past month and down 5.6% for the year so far. Yet, digging deeper, you notice that over the last three years, the stock has soared 58.2%, and over a five-year stretch, it has more than doubled, up an impressive 108.0%.
Some of these moves have aligned with wider shifts in the insurance sector and broader market sentiment, as investors reassess risk and growth outlooks for specialty financial companies. Whether you are already holding shares or thinking about starting a position, the tug-of-war between recent cautious sentiment and long-term growth is hard to ignore.
Now, when it comes to finding out if Brown & Brown is undervalued or not, the story gets interesting. Using a standard six-point checklist for valuation, the company only checks off one box, earning it a value score of 1. Of course, that is just the start. Next, we will break down the various valuation methods to see what they really say about the stock’s appeal. Plus, by the end, I will share an approach to valuing stocks that goes beyond just numbers and ratios.
Brown & Brown scores just 1/6 on our valuation checks. See what other red flags we found in the full valuation breakdown.
Approach 1: Brown & Brown Excess Returns Analysis
The Excess Returns valuation model focuses on how effectively a company generates returns above its cost of equity, measuring real economic value creation for shareholders. This involves assessing how much profit Brown & Brown can reliably generate over and above what it costs to fund its own equity capital, especially over the long term.
According to the data, Brown & Brown has a Book Value of $35.13 per share and a stable Earnings Per Share (EPS) of $3.08, as calculated from various analyst return-on-equity estimates. The company's Cost of Equity stands at $1.33 per share, while its Excess Return, the surplus profit earned after covering this cost, is $1.75 per share. On average, Brown & Brown has delivered a robust Return on Equity of 15.70%. Its Stable Book Value is noted as $19.60 per share based on the past five-year median, showing a solid capital base.
Taking all these figures into account, the Excess Returns model estimates Brown & Brown’s intrinsic fair value at $66.77 per share. Compared to the current market price, this implies the stock is trading 42.2% above its intrinsic value. In other words, the market is asking investors to pay a premium that does not appear justified by the company’s underlying economic returns, according to this method.
Result: OVERVALUED
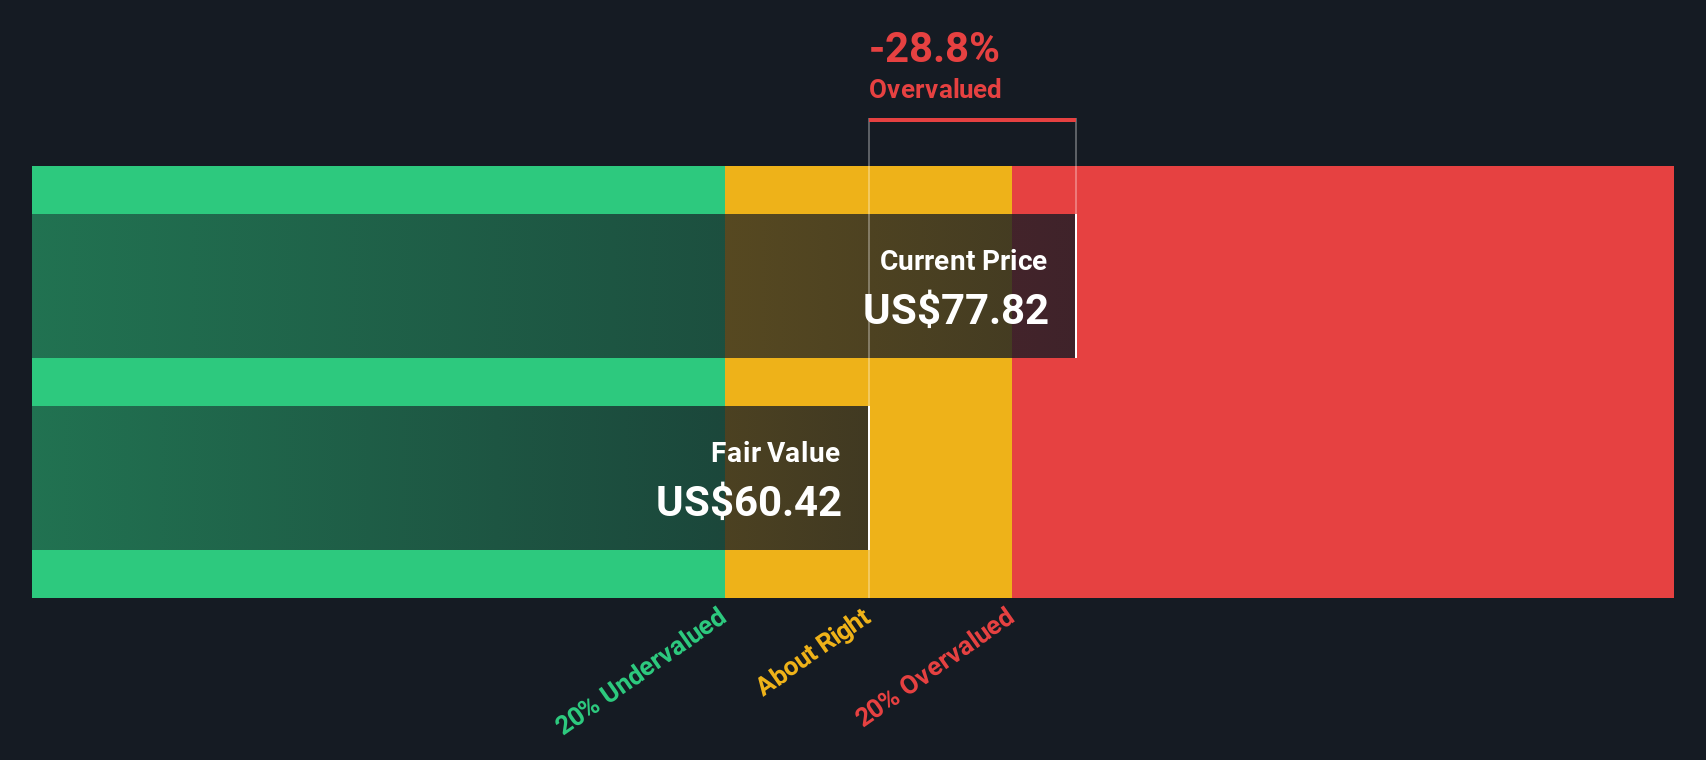
Our Excess Returns analysis suggests Brown & Brown may be overvalued by 42.2%. Find undervalued stocks or create your own screener to find better value opportunities.
Approach 2: Brown & Brown Price vs Earnings
For profitable companies like Brown & Brown, the Price-to-Earnings (PE) ratio is one of the most useful benchmarks for valuing a stock. This metric indicates how much investors are willing to pay today for a dollar of earnings, making it especially effective when the company has a stable profit track record.
The appropriate PE ratio for a business can vary widely, depending on growth prospects and how much risk investors perceive. Companies expected to grow faster or operate with less risk often deserve higher multiples, while slower growers or riskier firms typically trade on lower PE ratios.
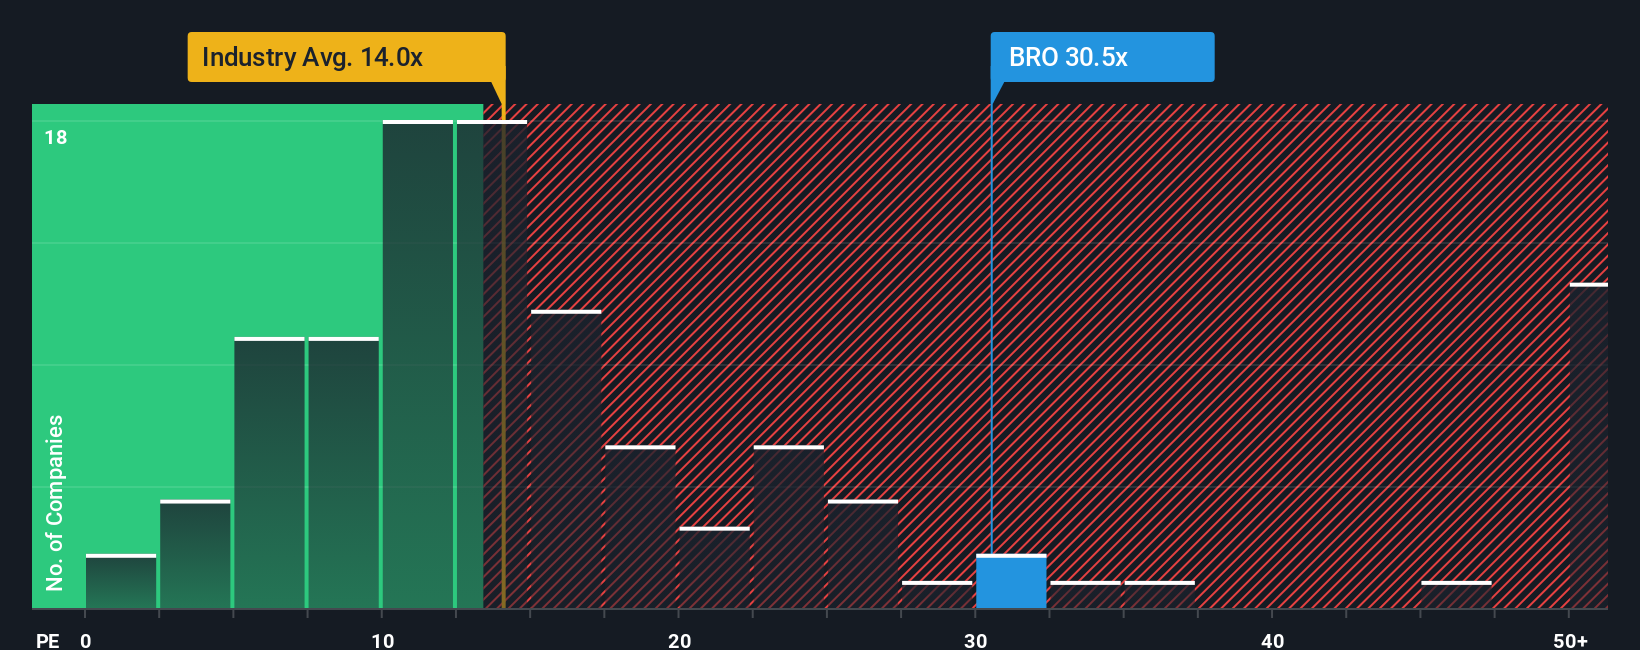
Brown & Brown's current PE ratio stands at 31.5x. For context, the average PE for its Insurance industry peers is 14.2x, while a peer group average is 57.7x. This places Brown & Brown well above the industry norm but below some of its closest competitors.
Simply Wall St's proprietary "Fair Ratio" provides a more nuanced benchmark. Instead of just comparing to industry or peers, the Fair Ratio (18.3x for Brown & Brown) is based on factors such as earnings growth, profit margins, company size, and risks specific to the business and sector. This creates a more tailored and insightful measure, helping investors see past headline multiples to what is truly justified.
When measured against this Fair Ratio, Brown & Brown’s current multiple of 31.5x appears significantly elevated. This suggests the stock’s price may not be fully supported by its underlying fundamentals at the moment.
Result: OVERVALUED
PE ratios tell one story, but what if the real opportunity lies elsewhere? Discover companies where insiders are betting big on explosive growth.
Upgrade Your Decision Making: Choose your Brown & Brown Narrative
Earlier, we mentioned there is an even better way to understand valuation. Let us introduce you to Narratives. A Narrative is simply your story or perspective about a company’s future, where you lay out why you think Brown & Brown will thrive or struggle, what growth drivers or risks matter most, and how that all connects to key numbers like future revenue, margins, and fair value estimates.
Rather than relying only on static ratios, Narratives link a company’s story to a financial forecast and then to a justifiable fair value. This approach is easy and accessible for anyone using Simply Wall St’s Community page, where millions of investors share and update their Narratives in real time.
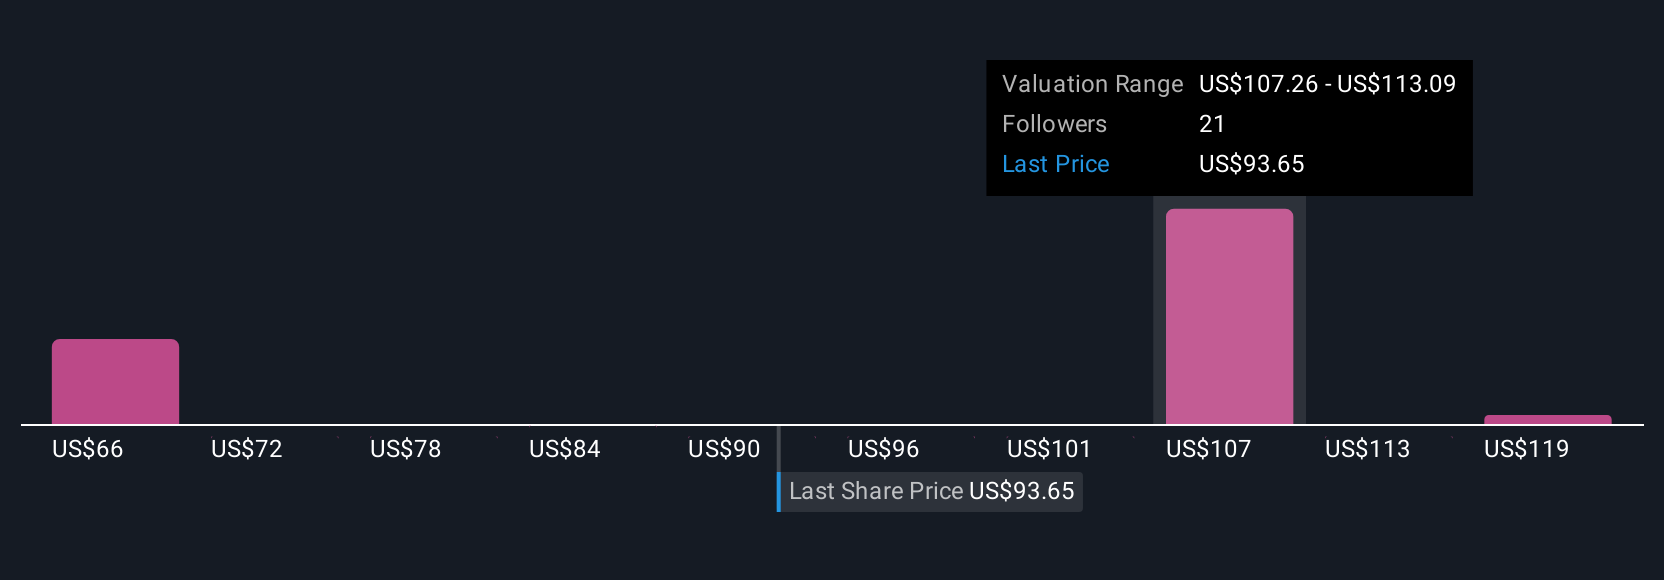
Narratives empower you to decide when to buy or sell by comparing your calculated fair value to the market price. Because they update dynamically as news or earnings arrive, you always have a current, relevant view. For instance, while some investors on Simply Wall St estimate Brown & Brown’s fair value as high as $130.00, others are more cautious, posting targets as low as $87.00. This reflects how individual stories and assumptions shape investment decisions.
Do you think there's more to the story for Brown & Brown? Create your own Narrative to let the Community know!
This article by Simply Wall St is general in nature. We provide commentary based on historical data and analyst forecasts only using an unbiased methodology and our articles are not intended to be financial advice. It does not constitute a recommendation to buy or sell any stock, and does not take account of your objectives, or your financial situation. We aim to bring you long-term focused analysis driven by fundamental data. Note that our analysis may not factor in the latest price-sensitive company announcements or qualitative material. Simply Wall St has no position in any stocks mentioned.
Have feedback on this article? Concerned about the content? Get in touch with us directly. Alternatively, email editorial-team@simplywallst.com