
Should You Reevaluate Cadence After a 217% Five Year Climb in 2025?
If you have been tracking Cadence Design Systems lately, you are definitely not alone. Investors and tech watchers alike have seen the stock steadily climb, gaining a remarkable 30.6% over the last year and an eye-catching 217.6% over five years. Even just this year, the share price is up by 16.7%, a sign that the market continues to appreciate Cadence's role in powering advancements in electronic design automation and chip development. Short-term dips like last week's slight 1.1% decline often get attributed to broader market jitters rather than anything specific to Cadence, but the long-term trend is what is grabbing attention.
With such gains, a big question naturally emerges: is Cadence still a buy after this kind of run? Or are buyers paying a premium for all that future innovation? Looking at it with a traditional value lens, Cadence carries a valuation score of 0 out of 6, which means it's considered overvalued by every standard metric we check. That sounds pretty decisive, but valuation is never quite that simple, especially with a company known for consistent growth in a fast-changing market.
Let’s dig into the major valuation approaches investors use and see how Cadence stacks up. And stick around, because at the end, we will cover a perspective on valuation that is often overlooked but could matter even more than the numbers alone.
Cadence Design Systems scores just 0/6 on our valuation checks. See what other red flags we found in the full valuation breakdown.
Approach 1: Cadence Design Systems Discounted Cash Flow (DCF) Analysis
The Discounted Cash Flow (DCF) valuation is a common method investors use to estimate a company's intrinsic value by projecting its future free cash flows and discounting them back to today's dollars. It answers the basic question: if you owned the business and pocketed all its expected future cash, what would that stream be worth right now?
For Cadence Design Systems, the latest reported Free Cash Flow (FCF) stands at $1.57 billion. Analyst projections suggest this figure will continue rising steadily, reaching about $2.54 billion by 2029. Estimates are available for the next five years. For periods further in the future, projections are extended using long-term growth assumptions. This strong anticipated growth in FCF is crucial because the majority of Cadence’s estimated value comes from these future gains rather than current profits.
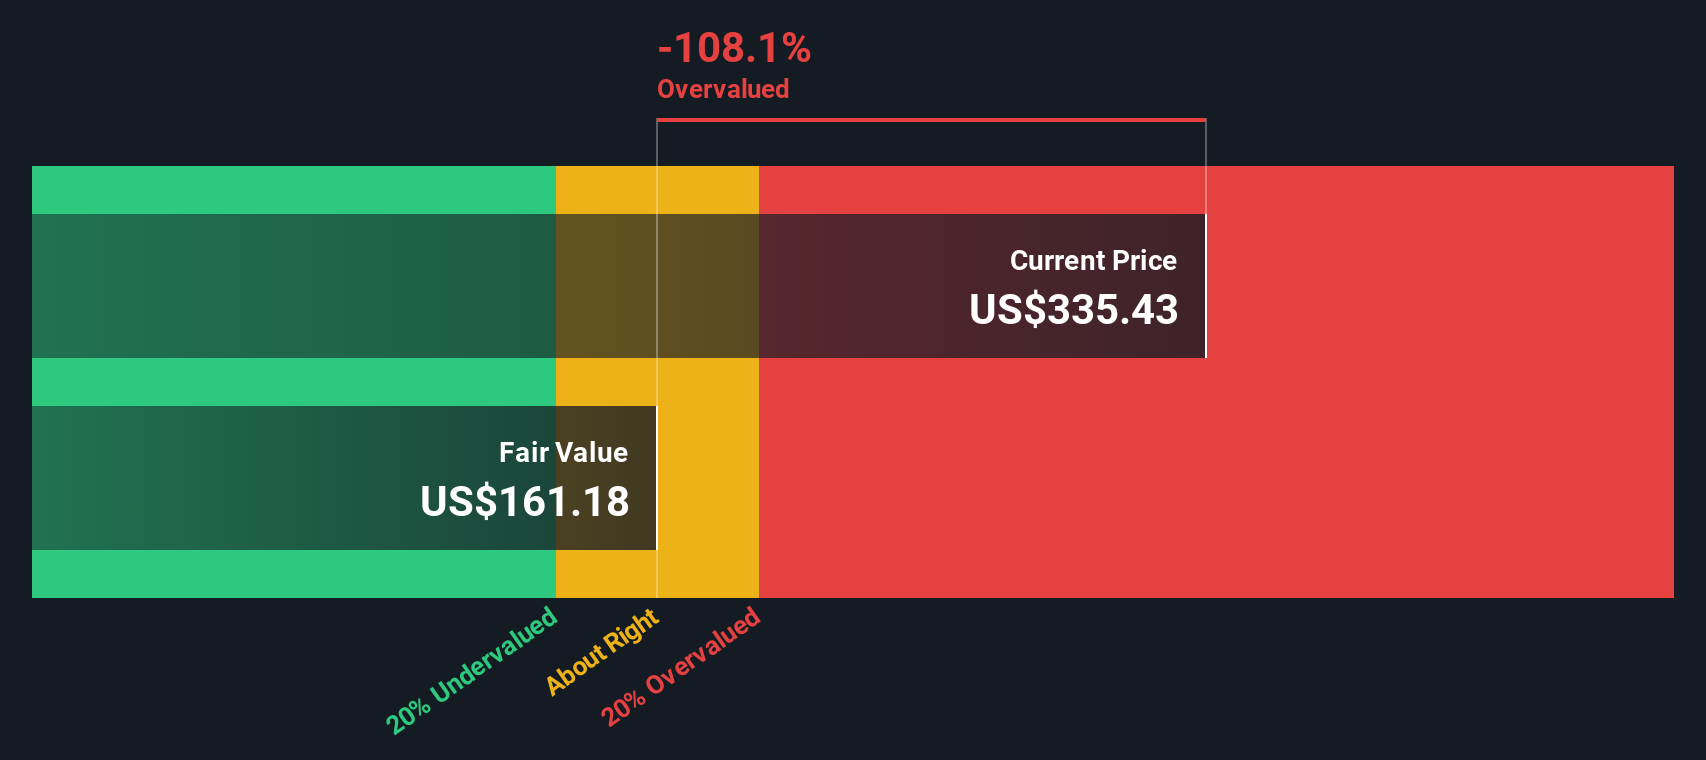
Applying the DCF model’s two-stage calculation, the intrinsic value per share is $166.46. Comparing this to Cadence’s current share price, the stock appears 108.6% overvalued. According to this model, investors are paying a steep premium for the company’s projected growth, far above what the underlying cash flows justify today.
Result: OVERVALUED
Our Discounted Cash Flow (DCF) analysis suggests Cadence Design Systems may be overvalued by 108.6%. Find undervalued stocks or create your own screener to find better value opportunities.
Approach 2: Cadence Design Systems Price vs Earnings
The Price-to-Earnings (PE) ratio is a go-to valuation metric for profitable companies like Cadence Design Systems. It allows investors to weigh how much they are paying for every dollar of the company's earnings, which is especially useful when the business consistently generates profit. Growth prospects and perceived risk also play a major role in shaping what is considered a “normal” or “fair” PE, as high-growth or safer companies typically warrant higher PE ratios compared to slower-growing or riskier peers.
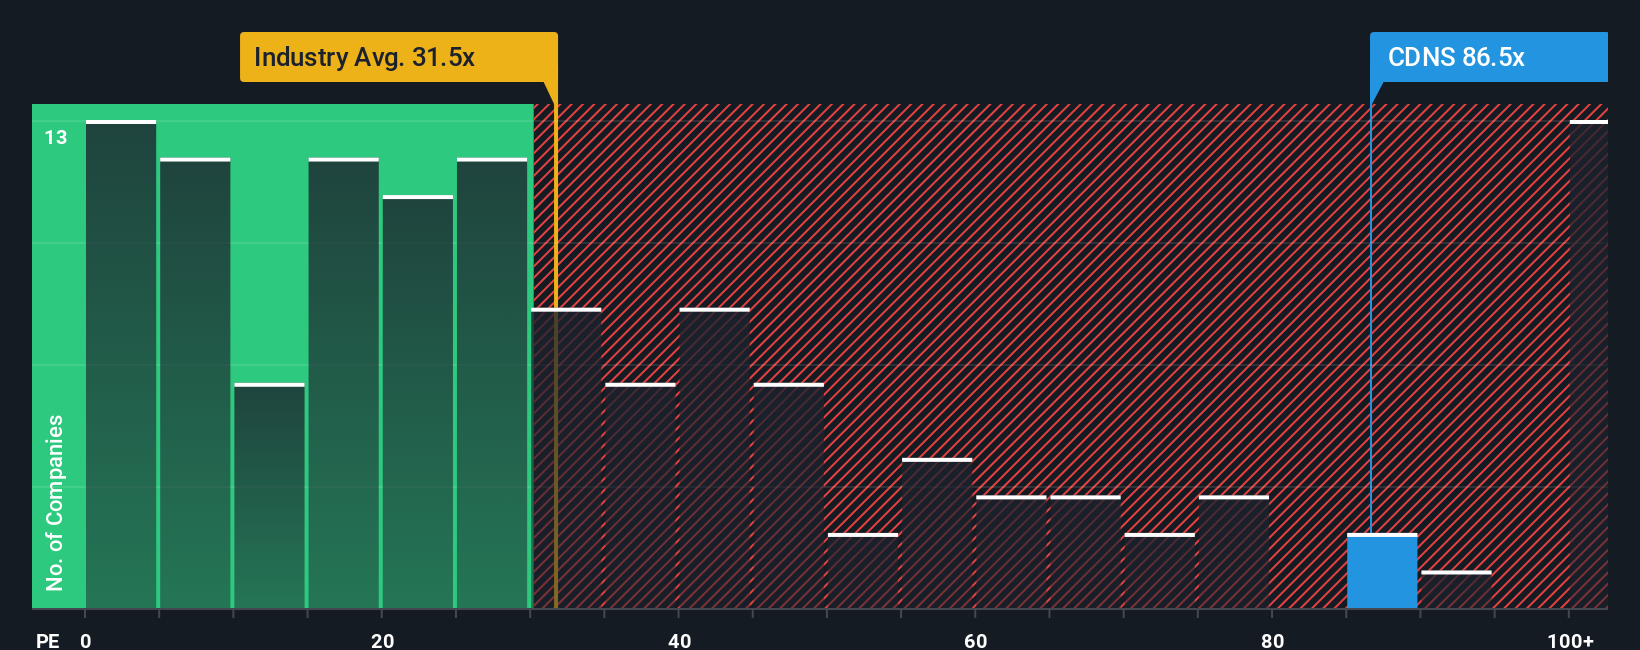
At present, Cadence trades at a PE ratio of 93.5x. By comparison, the average PE for the software industry sits at 35.6x, while comparable peers average around 67.0x. These figures show that the market is valuing Cadence’s earnings at a significant premium, likely reflecting both its robust growth track record and future expectations.
To cut through this noise, Simply Wall St’s Fair Ratio goes beyond basic averages and tailors the expected PE based on Cadence’s earnings growth, margins, risk profile, size, and industry factors. For Cadence, the Fair Ratio is 42.5x. This method gives a more precise measure of fair value instead of just benchmarking against broad industry or peer numbers, since it adjusts for the company’s unique competitive advantages and risk factors.
Comparing those numbers, Cadence’s actual PE of 93.5x is much higher than the Fair Ratio of 42.5x. This points toward the shares being meaningfully overvalued on an earnings basis.
Result: OVERVALUED
PE ratios tell one story, but what if the real opportunity lies elsewhere? Discover companies where insiders are betting big on explosive growth.
Upgrade Your Decision Making: Choose your Cadence Design Systems Narrative
Earlier we mentioned that there is an even better way to understand valuation, so let's introduce you to Narratives. In investing, a Narrative is simply the story you believe about a company. This story includes the reasons behind your assumptions for fair value, future revenue, earnings, and profit margins. Narratives connect the company’s unique story and competitive advantages directly to your forecasts and, ultimately, an estimated fair value, pairing financial analysis with your personal perspective.
On Simply Wall St’s Community page, millions of investors use Narratives as a simple, interactive way to express their viewpoint, see others’ takes, and adjust their forecasts as news and earnings data update automatically. Narratives make it easy to see how your story and fair value compare to the current stock price, helping you decide when to buy or sell. For Cadence Design Systems, for example, some investors expect rapid AI-led growth and see fair value as high as $410 per share, while others are more cautious because of competition and assign a fair value closer to $200. Narratives put these perspectives side by side so you can make investment decisions that truly fit your view of the company.
Do you think there's more to the story for Cadence Design Systems? Create your own Narrative to let the Community know!

This article by Simply Wall St is general in nature. We provide commentary based on historical data and analyst forecasts only using an unbiased methodology and our articles are not intended to be financial advice. It does not constitute a recommendation to buy or sell any stock, and does not take account of your objectives, or your financial situation. We aim to bring you long-term focused analysis driven by fundamental data. Note that our analysis may not factor in the latest price-sensitive company announcements or qualitative material. Simply Wall St has no position in any stocks mentioned.
Have feedback on this article? Concerned about the content? Get in touch with us directly. Alternatively, email editorial-team@simplywallst.com