
PetroTal (TSX:TAL): Assessing Valuation After Buyback Activity and S&P Global BMI Index Inclusion
PetroTal (TSX:TAL) has caught investor attention following its recent share buyback activity and its addition to the S&P Global BMI Index. These events could shape both the company’s capital structure and market profile in the months ahead.
See our latest analysis for PetroTal.
PetroTal’s addition to the S&P Global BMI Index and ongoing share buybacks have kept the spotlight on the company. While technical issues have recently tempered strong field production, the momentum in PetroTal’s market profile remains clear. Over the past year, the total shareholder return sits at 7%, and the stock’s multi-year performance has been robust. Investors seem to be balancing short-term production bumps with confidence in the company’s long-term approach and valuation.
If events like new index inclusions catch your attention, consider broadening your search and discover fast growing stocks with high insider ownership
Given its recent index inclusion, strategic buybacks and still-solid production numbers, is PetroTal now undervalued and offering investors a potential entry point, or is the market already factoring in the company’s future growth prospects?
Price-to-Earnings of 5.3x: Is it justified?
PetroTal's current Price-to-Earnings ratio stands at just 5.3x, compared to peers averaging 9.5x. This suggests the stock is trading at a significant discount relative to other companies in the sector.
The Price-to-Earnings (P/E) ratio measures how much investors are willing to pay for each dollar of earnings. For an oil and gas company like PetroTal, this ratio highlights market expectations around future profitability and sector challenges such as volatile commodity prices.
With a markedly lower P/E than both its peer group and industry average, the market appears to be underpricing PetroTal's earning potential. This gap could either signal undervaluation or reveal that the market is anticipating future challenges not currently reflected in the earnings figure. Notably, the estimated fair Price-to-Earnings ratio is 7.7x. Markets may move toward this level if sentiment improves or performance surprises to the upside.
Explore the SWS fair ratio for PetroTal
Result: Price-to-Earnings of 5.3x (UNDERVALUED)
However, slowing net income growth and recent production challenges may weigh on future upside. This provides caution for investors watching the undervaluation case.
Find out about the key risks to this PetroTal narrative.
Another View: Discounted Cash Flow Model
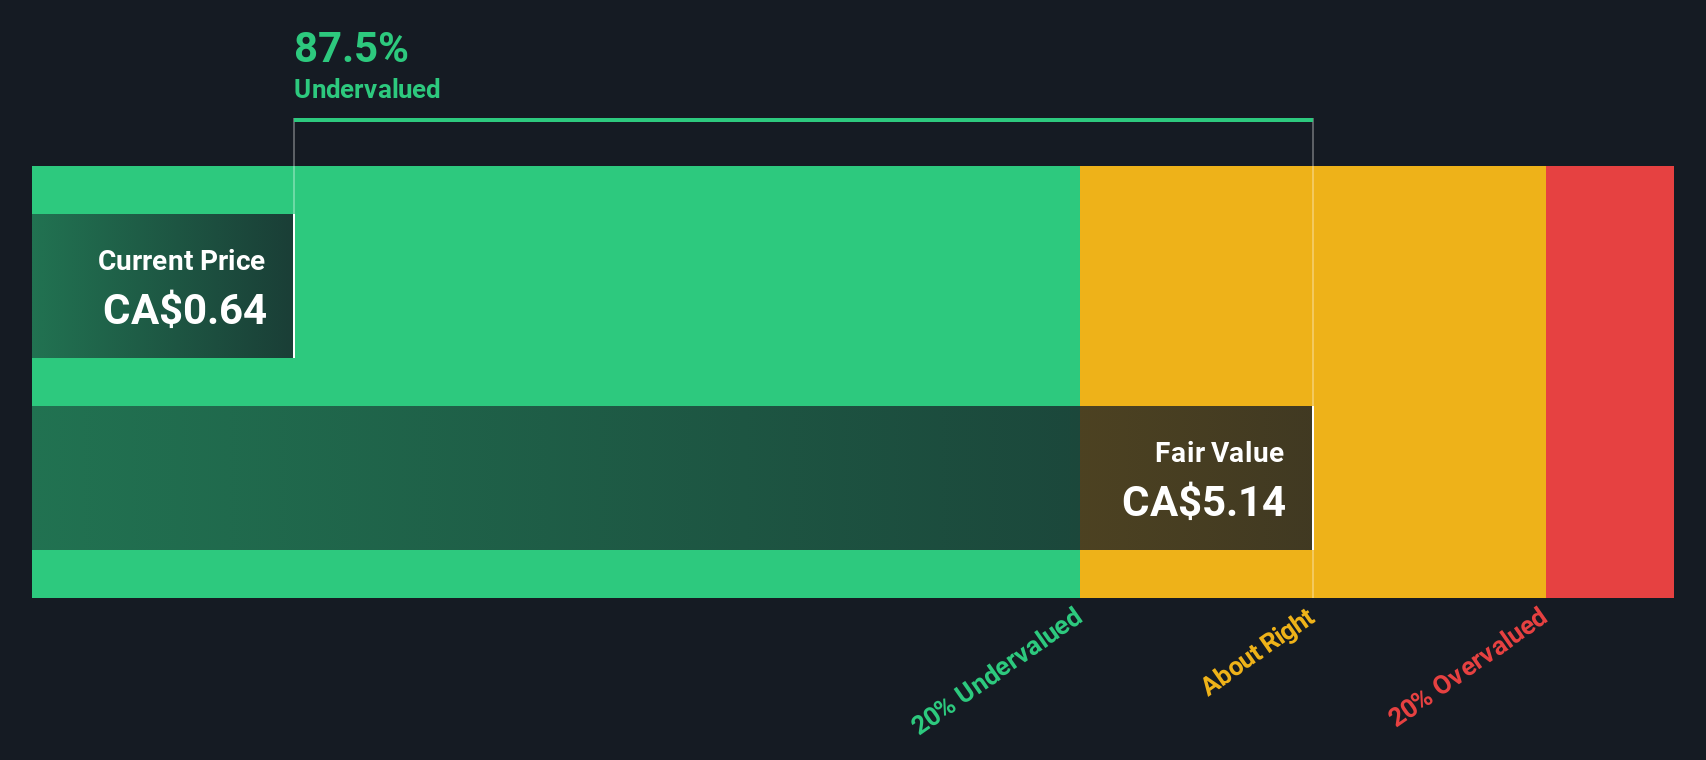
To balance out the picture from earnings multiples, the SWS DCF model offers another perspective. Based on projected cash flows, PetroTal is trading at CA$0.62, while our DCF model suggests fair value at CA$5.20. This indicates significant undervaluation. Does this signal an overlooked opportunity, or does the market see risks in those forecasts?
Look into how the SWS DCF model arrives at its fair value.
Simply Wall St performs a discounted cash flow (DCF) on every stock in the world every day (check out PetroTal for example). We show the entire calculation in full. You can track the result in your watchlist or portfolio and be alerted when this changes, or use our stock screener to discover undervalued stocks based on their cash flows. If you save a screener we even alert you when new companies match - so you never miss a potential opportunity.
Build Your Own PetroTal Narrative
If you have your own views or prefer to dive deeper into the numbers, you can shape your own findings and perspective in just minutes. Do it your way
A great starting point for your PetroTal research is our analysis highlighting 3 key rewards and 4 important warning signs that could impact your investment decision.
Looking for more investment ideas?
Don’t let opportunity pass by. Take charge of your portfolio and get ahead with unique stock ideas from the Simply Wall Street Screener.
- Capture steady income opportunities with high-yield picks by checking out these 19 dividend stocks with yields > 3%, delivering 3%+ returns for smart, income-focused investors.
- Tap into the future of computing by joining these 26 quantum computing stocks, spotlighting companies pushing boundaries in quantum breakthroughs and emerging tech frontiers.
- Fuel your growth strategy with these 904 undervalued stocks based on cash flows, revealing stocks trading below their true worth based on powerful cash flow insights.
This article by Simply Wall St is general in nature. We provide commentary based on historical data and analyst forecasts only using an unbiased methodology and our articles are not intended to be financial advice. It does not constitute a recommendation to buy or sell any stock, and does not take account of your objectives, or your financial situation. We aim to bring you long-term focused analysis driven by fundamental data. Note that our analysis may not factor in the latest price-sensitive company announcements or qualitative material. Simply Wall St has no position in any stocks mentioned.
Have feedback on this article? Concerned about the content? Get in touch with us directly. Alternatively, email editorial-team@simplywallst.com