
- PREMIUM
- LIVE QUOTES
- INSTITUTIONS
 Index Options
 State Street
 CME Group
 Nasdaq
 Cboe
Cboe TradingView
 Wall Street Journal
Is Now the Right Moment to Revisit Philip Morris Amid Regulatory Uncertainty in 2025?
If you’re eyeing Philip Morris International and wondering whether now is the time to hold, buy, or move on, you’re not alone. This stock has rewarded confident hands for years, yet recent price action is making investors do a double-take. Over the last five years, Philip Morris International has soared an impressive 158.1%, and even its three-year return stands at 112.8%. These results could make anyone feel optimistic. However, more recently, the share price has retraced modestly, down 3.7% in the past week and 5.7% this month. This may have less to do with any single headline and more with market sentiment shifting as investors weigh global economic trends and tobacco regulation developments against a backdrop of robust long-term performance.
So, is now an opportunity to buy into continued growth, or a warning sign that risk perception is changing for good? To get a clearer answer, we need to turn to the numbers. Based on our valuation scorecard, which includes six key checks for signs of undervaluation, Philip Morris International ticks the box on three. That places its current value score at 3 out of 6, suggesting the company is attractively priced by some measures but hasn’t set off a full-blown bargain alert yet. Let’s dive into those valuation approaches and put them to work. Stick around, because the best way to judge value might surprise you by the end of this article.
Why Philip Morris International is lagging behind its peers
Approach 1: Philip Morris International Discounted Cash Flow (DCF) Analysis
A Discounted Cash Flow (DCF) model estimates a company's intrinsic value by projecting its future cash flows and discounting them back to today's dollars. For Philip Morris International, this approach starts with a robust foundation. The company generated over $8.9 billion in Free Cash Flow (FCF) over the last twelve months. According to analyst projections and further extrapolation, by 2029, annual FCF is expected to reach $16.3 billion, with incremental gains anticipated each year. This steady increase hints at consistent operational performance and suggests that Philip Morris may continue generating substantial cash flows in the long term.
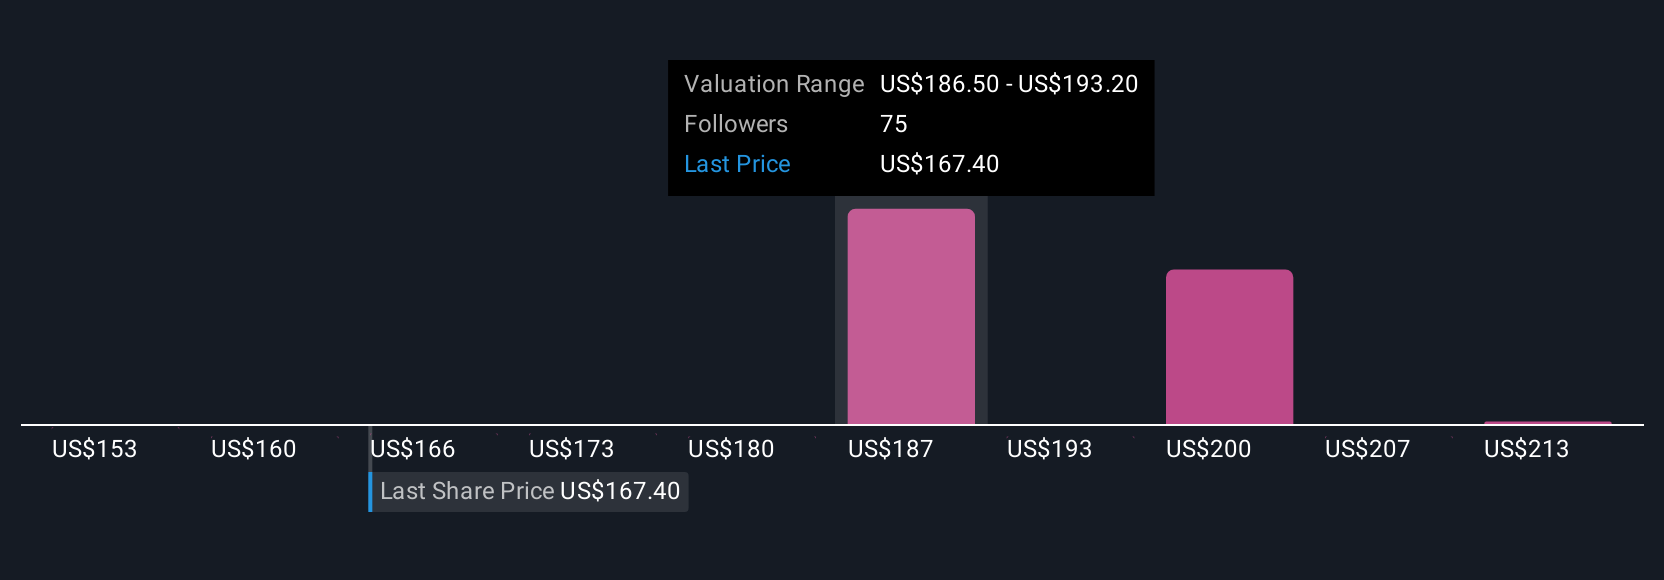
Running these numbers through a 2 Stage Free Cash Flow to Equity model, the DCF arrives at an intrinsic value of $200.49 per share. With the stock now trading at a 21.2% discount to this calculated fair value, the model signals the shares are currently undervalued based on future cash flow expectations.
Result: UNDERVALUED

Our Discounted Cash Flow (DCF) analysis suggests Philip Morris International is undervalued by 21.2%. Track this in your watchlist or portfolio, or discover more undervalued stocks.
Approach 2: Philip Morris International Price vs Earnings
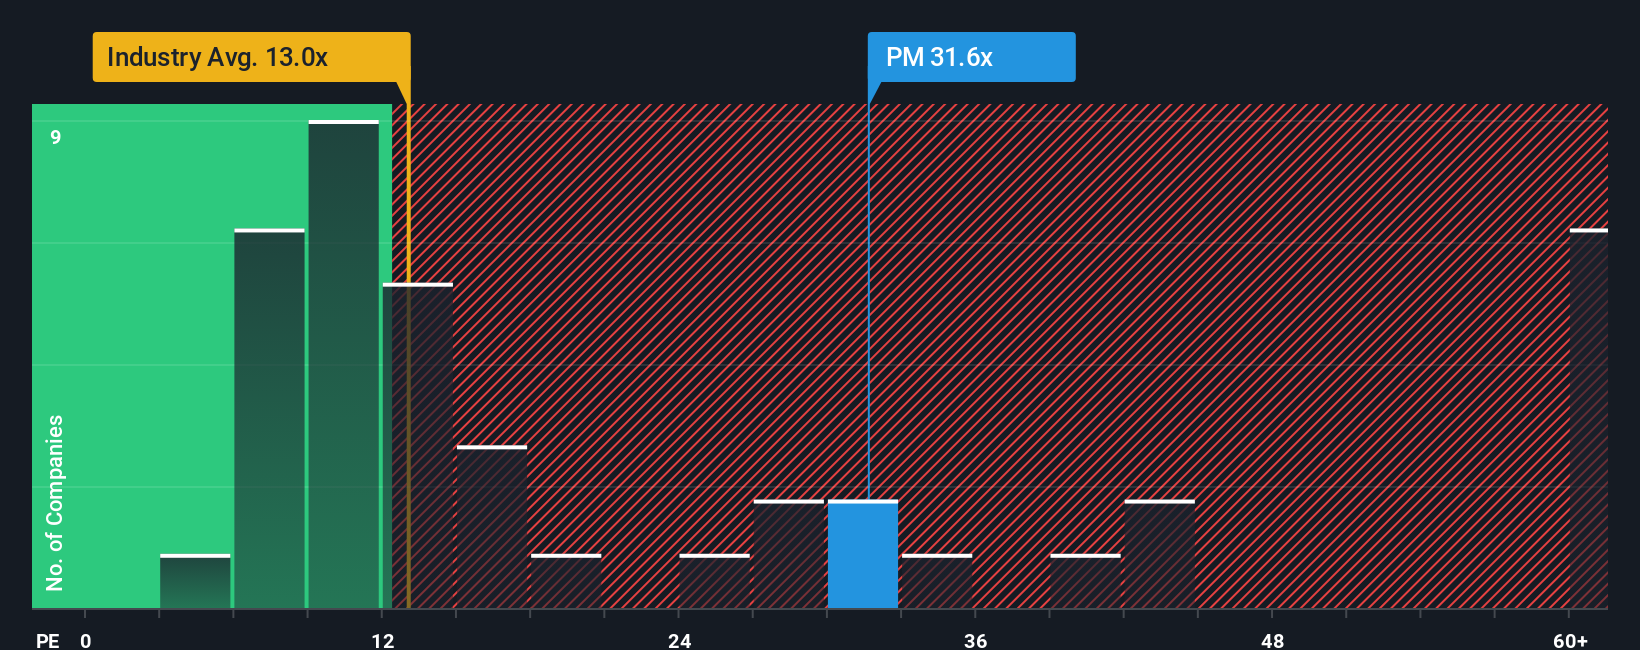
When evaluating profitable companies like Philip Morris International, the Price-to-Earnings (PE) ratio is a practical and widely used valuation tool. This metric compares a company’s current share price to its per-share earnings, helping investors gauge how much they're paying for each dollar of profit. Generally, what counts as a "normal" or "fair" PE ratio depends on growth expectations and risk. Higher growth or lower risk typically command higher multiples.
At the moment, Philip Morris International trades at a PE ratio of 29.95x. This is notably higher than both the Tobacco industry average of 14.86x and the peer average of 18.80x. Such a premium might raise eyebrows, suggesting that the market sees something special in Philip Morris, whether it is resilience, brand strength, or future prospects.
To cut through the noise of simple peer or industry comparisons, Simply Wall St's proprietary "Fair Ratio" method does the heavy lifting. The Fair Ratio for Philip Morris, currently set at 30.52x, reflects a more nuanced view by factoring in key aspects such as earnings growth, margins, risk profile, industry characteristics, and market capitalization. This approach provides a more comprehensive assessment, as it accounts for what makes Philip Morris unique beyond generic peer grouping.
Comparing the Fair Ratio of 30.52x to the company’s current PE of 29.95x, the difference is minimal. This suggests the stock is trading very close to what would be considered its fair value relative to its earnings and underlying fundamentals.
Result: ABOUT RIGHT
PE ratios tell one story, but what if the real opportunity lies elsewhere? Discover companies where insiders are betting big on explosive growth.
Upgrade Your Decision Making: Choose your Philip Morris International Narrative
Earlier we mentioned that there is an even better way to understand valuation, so let’s introduce you to Narratives. Narratives take investing beyond simple numbers by letting you attach a story or perspective to a company and link it directly to your financial forecast. This process combines your personal assumptions about future revenue, earnings, and margins into a single view that calculates a fair value. In other words, a Narrative is your investment thesis, captured in both words and numbers.
Simply Wall St’s Narratives tool, found on the Community page and used by millions of investors, makes creating, comparing, and updating these perspectives remarkably easy. Narratives show how each person’s view—whether optimistic, cautious, or somewhere in between—maps to a fair value and can be instantly compared to the current share price. This makes it far simpler to decide whether to buy, hold, or sell as new information, such as earnings or news, becomes available.
For example, one Narrative assigns a bullish fair value of $220, expecting strong smoke-free growth and margin expansion. Another sees a more cautious fair value of $153, citing regulatory hurdles and declining demand as the biggest risks.
For Philip Morris International, we'll make it really easy for you with previews of two leading Philip Morris International Narratives:
🐂 Philip Morris International Bull Case
Fair Value: $220.00
Current Price is 28.2% below this fair value
Assumed Revenue Growth Rate: 10.9%
- Rapid growth in ZYN and smoke-free products, particularly in emerging markets, is expected to unlock sustained revenue and market share gains well above consensus forecasts.
- Expansion into wellness, healthcare, and digital platforms diversifies revenue streams and supports higher margins and industry leadership.
- Risks include regulatory challenges, cigarette volume decline, rising illicit trade, and ESG pressures. However, a strong balance sheet and global scale give PMI tools to outpace competitors.
🐻 Philip Morris International Bear Case
Fair Value: $153.00
Current Price is 3.2% above this fair value
Assumed Revenue Growth Rate: 6.4%
- Intensifying public health sentiment and tougher regulation threaten growth of both traditional and next-generation products, putting future revenue and margins at risk.
- ESG-driven divestment and rising investment requirements could squeeze profitability, especially if regulatory approvals lag or consumer adoption underwhelms.
- Despite diversification and innovation supporting margins, analysts worry that current market optimism overstates likely returns, making the shares look overvalued versus realistic earnings expectations.
Do you think there's more to the story for Philip Morris International? Create your own Narrative to let the Community know!
This article by Simply Wall St is general in nature. We provide commentary based on historical data and analyst forecasts only using an unbiased methodology and our articles are not intended to be financial advice. It does not constitute a recommendation to buy or sell any stock, and does not take account of your objectives, or your financial situation. We aim to bring you long-term focused analysis driven by fundamental data. Note that our analysis may not factor in the latest price-sensitive company announcements or qualitative material. Simply Wall St has no position in any stocks mentioned.
Have feedback on this article? Concerned about the content? Get in touch with us directly. Alternatively, email editorial-team@simplywallst.com