
A Closer Look at Amentum Holdings (AMTM) Valuation Following Recent Share Price Momentum
Amentum Holdings (AMTM) has caught some attention as its stock showed a slight dip today, closing at $25.15. Over the past week, shares have climbed 12%, while the stock has edged higher by 16% since January.
See our latest analysis for Amentum Holdings.
Amentum Holdings’ 16% year-to-date share price return hints at building momentum, despite today’s modest pullback and a slight year-on-year dip in total shareholder return. The overall picture suggests investors are warming to its growth prospects. This recent rally follows a period of lackluster long-term performance.
If you’re interested in finding other companies gaining traction in the market, now’s a great time to broaden your search and discover fast growing stocks with high insider ownership
With Amentum’s share price running ahead of earnings but still sitting below analyst targets, the key question is whether momentum will continue from here or if the market has already factored in the company’s future growth prospects.
Price-to-Earnings of 117.7x: Is it justified?
Amentum Holdings is currently trading at a price-to-earnings ratio of 117.7x, a level that stands out when compared to similar companies in the market. With the last close at $25.15, this multiple suggests the market has high expectations for future earnings growth that may already be factored into the share price.
The price-to-earnings (P/E) ratio measures how much investors are willing to pay today for a dollar of the company’s earnings. In sectors like professional services, the P/E offers insight into how the market values companies based on profitability. For Amentum, such a lofty P/E can indicate confidence in continued earnings momentum or, conversely, that investors may be overpaying relative to current profit generation.
This elevated P/E ratio is not just a premium over Amentum’s industry counterparts. The company’s P/E is significantly above the US Professional Services industry average of 26.7x, as well as the peer average of 21.2x. In fact, even the estimated “fair” P/E ratio for Amentum is just 44.7x, highlighting how far the current valuation exceeds calculated benchmarks. If the market shifts closer to these comparative ratios, a significant repricing could follow.
Explore the SWS fair ratio for Amentum Holdings
Result: Price-to-Earnings of 117.7x (OVERVALUED)
However, slower revenue growth or a sudden reversal in profitability could quickly challenge the market’s optimistic outlook for Amentum Holdings.
Find out about the key risks to this Amentum Holdings narrative.
Another View: What Does Our DCF Model Suggest?
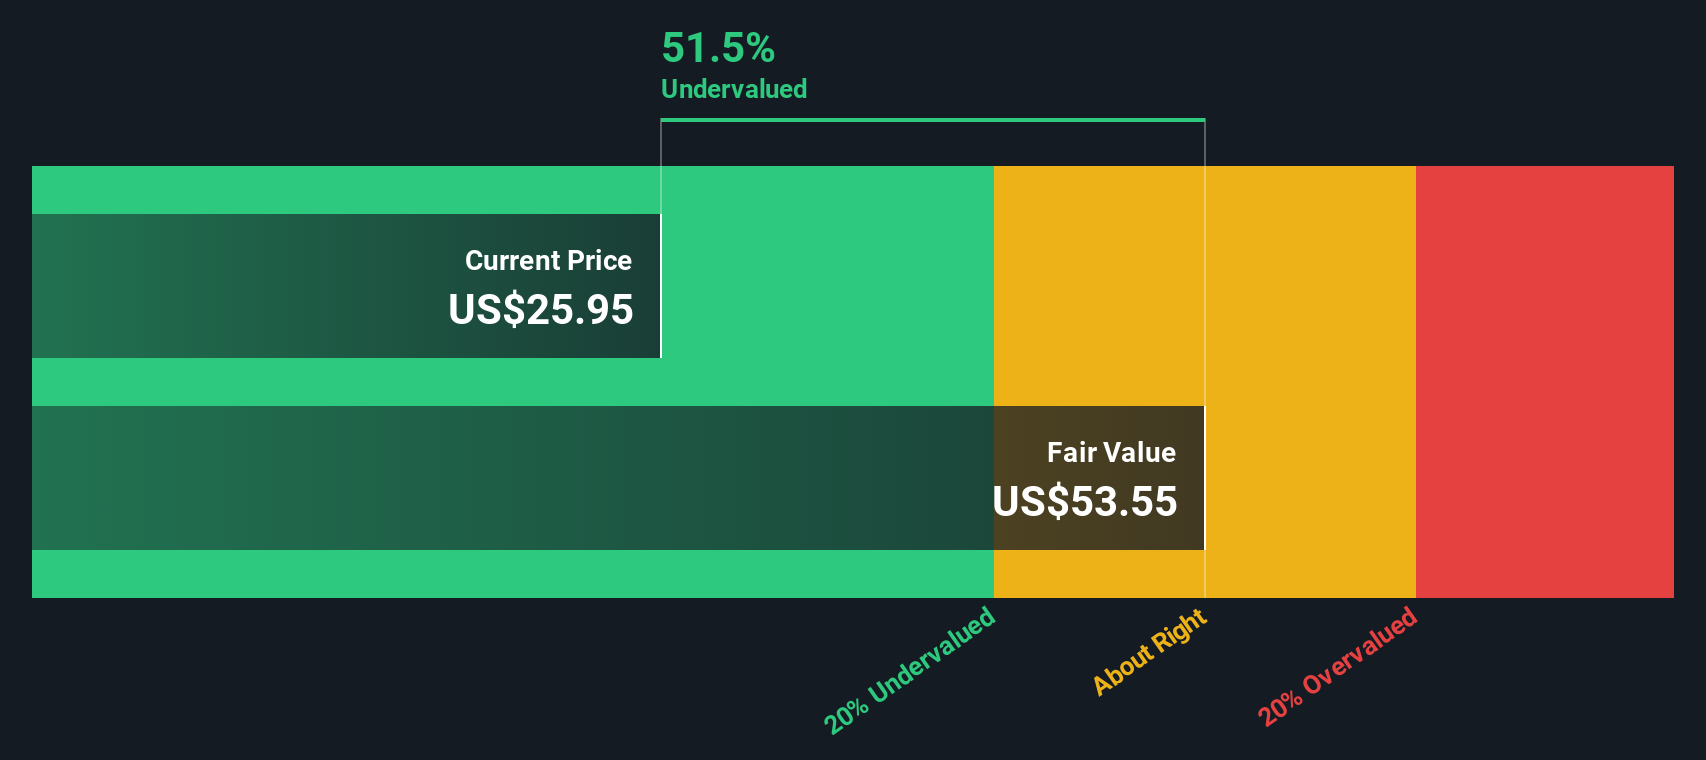
While the high price-to-earnings ratio raises valuation concerns, our DCF model arrives at a different conclusion. Based on future cash flow estimates, Amentum Holdings appears significantly undervalued, trading about 52.5% below its calculated fair value. If so, is the market mispricing the stock’s true potential?
Look into how the SWS DCF model arrives at its fair value.
Simply Wall St performs a discounted cash flow (DCF) on every stock in the world every day (check out Amentum Holdings for example). We show the entire calculation in full. You can track the result in your watchlist or portfolio and be alerted when this changes, or use our stock screener to discover undervalued stocks based on their cash flows. If you save a screener we even alert you when new companies match - so you never miss a potential opportunity.
Build Your Own Amentum Holdings Narrative
If you want to look beneath the surface or challenge the story laid out here, you can easily craft your perspective in just a few minutes: Do it your way
A great starting point for your Amentum Holdings research is our analysis highlighting 3 key rewards and 2 important warning signs that could impact your investment decision.
Looking for more investment ideas?
The market constantly offers new opportunities, and with the right tools, you can spot potential before the crowd. Use these powerful screeners to give yourself an investing edge. Don’t let the next breakout stock slip by!
- Unlock the potential of up-and-coming companies by checking out these 3568 penny stocks with strong financials positioned for rapid financial growth and industry disruption.
- Seize the chance for reliable portfolio income by evaluating these 19 dividend stocks with yields > 3% featuring top stocks with strong dividend yields and solid fundamentals.
- Get ahead of Wall Street by reviewing these 24 AI penny stocks spotlighting businesses pioneering advancements in artificial intelligence across multiple sectors.
This article by Simply Wall St is general in nature. We provide commentary based on historical data and analyst forecasts only using an unbiased methodology and our articles are not intended to be financial advice. It does not constitute a recommendation to buy or sell any stock, and does not take account of your objectives, or your financial situation. We aim to bring you long-term focused analysis driven by fundamental data. Note that our analysis may not factor in the latest price-sensitive company announcements or qualitative material. Simply Wall St has no position in any stocks mentioned.
Have feedback on this article? Concerned about the content? Get in touch with us directly. Alternatively, email editorial-team@simplywallst.com