
How Will New US Chip Tariffs Impact AMD Stock in 2025?
If you have Advanced Micro Devices on your radar, you are definitely not alone. Whether you are already holding AMD shares or wondering if now is the time to jump in, let us take a look at what has been driving this stock and where things might be headed. Over the past year, AMD’s stock price has moved in a way that keeps investors on their toes, from dipping 3.0% over twelve months to an impressive 32.2% year-to-date gain. That sort of turnaround shows how quickly sentiment and outlook can change, especially in today’s tech-driven market.
Recent news stories have added even more fuel to the mix. Headlines about new U.S. policies encouraging domestic chip production, proposed tariffs on semiconductor imports, and ongoing trade tensions with China have all shifted perceptions about risk and reward for AMD and the industry as a whole. The potential benefits of overseas demand or challenges from trade barriers can swing share prices as fast as breaking news hits the wire. Despite a 1.3% gain just in the past week, the stock is still down 1.9% over the last month. This highlights how fast things can change based on the wider political and supply chain landscape.
All these developments lead to the big question: how does AMD stack up on valuation? Using the standard six-check valuation score, AMD comes in at 0, meaning the company does not currently screen as undervalued on any of the points we measure. But before you make up your mind, let us explore the valuation frameworks in more detail and then look at one smarter way to assess a company’s true worth.
Advanced Micro Devices scores just 0/6 on our valuation checks. See what other red flags we found in the full valuation breakdown.Approach 1: Advanced Micro Devices Discounted Cash Flow (DCF) Analysis
The Discounted Cash Flow (DCF) model estimates a company's intrinsic value by projecting its future cash flows and discounting them back to today’s value. For Advanced Micro Devices, this approach starts with its current Free Cash Flow, which stands at $4.1 Billion. Analysts provide estimates for the next five years, and these projections are extended out to a total of ten years by Simply Wall St to capture long-term growth potential.
AMD's Free Cash Flow is forecast to grow significantly, with projections reaching $16.3 Billion by 2029. According to the 2 Stage Free Cash Flow to Equity model, each year's future cash is discounted to reflect its present value, resulting in a calculated fair value of $153.91 per share. When compared to AMD’s current share price, this represents a 3.6% premium, implying the stock is presently about 3.6% overvalued on a DCF basis.
In summary, while AMD’s cash flow trajectory looks strong, the DCF analysis suggests the stock is currently priced slightly above its fair value, though not by a dramatic margin.
Result: ABOUT RIGHT
Head to the Valuation section of our Company Report for more details on how we arrive at this Fair Value for Advanced Micro Devices.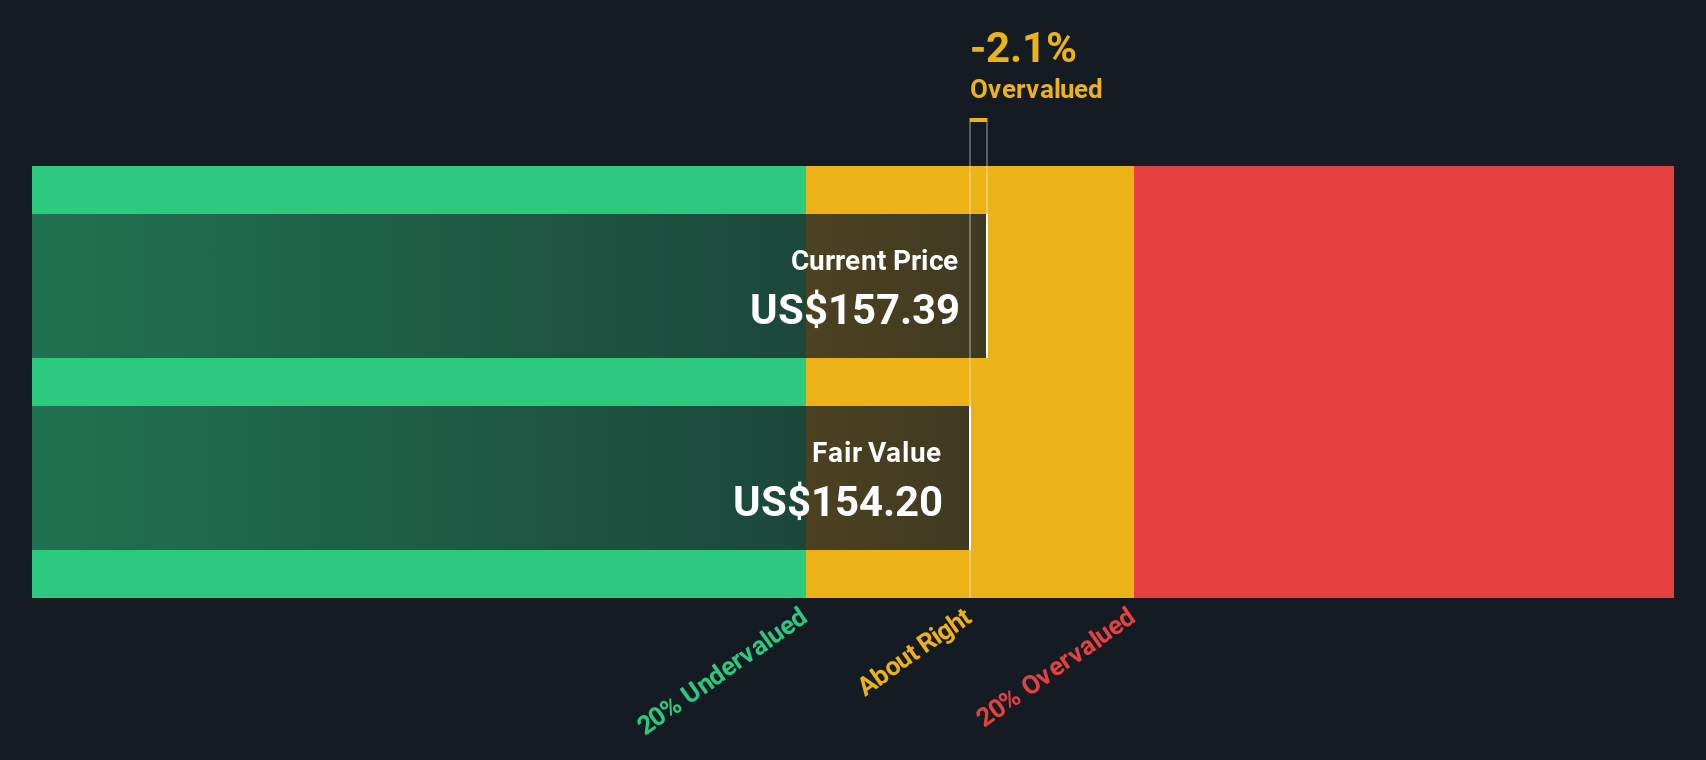
Approach 2: Advanced Micro Devices Price vs Earnings
The Price-to-Earnings (PE) ratio is a widely used metric for evaluating profitable companies such as Advanced Micro Devices. It shows how much investors are willing to pay for each dollar of earnings, which makes it especially relevant for established firms with strong, recurring profits. Companies with higher growth prospects and lower risks typically command higher PE ratios. Those facing uncertainties or slower growth will have lower ones.
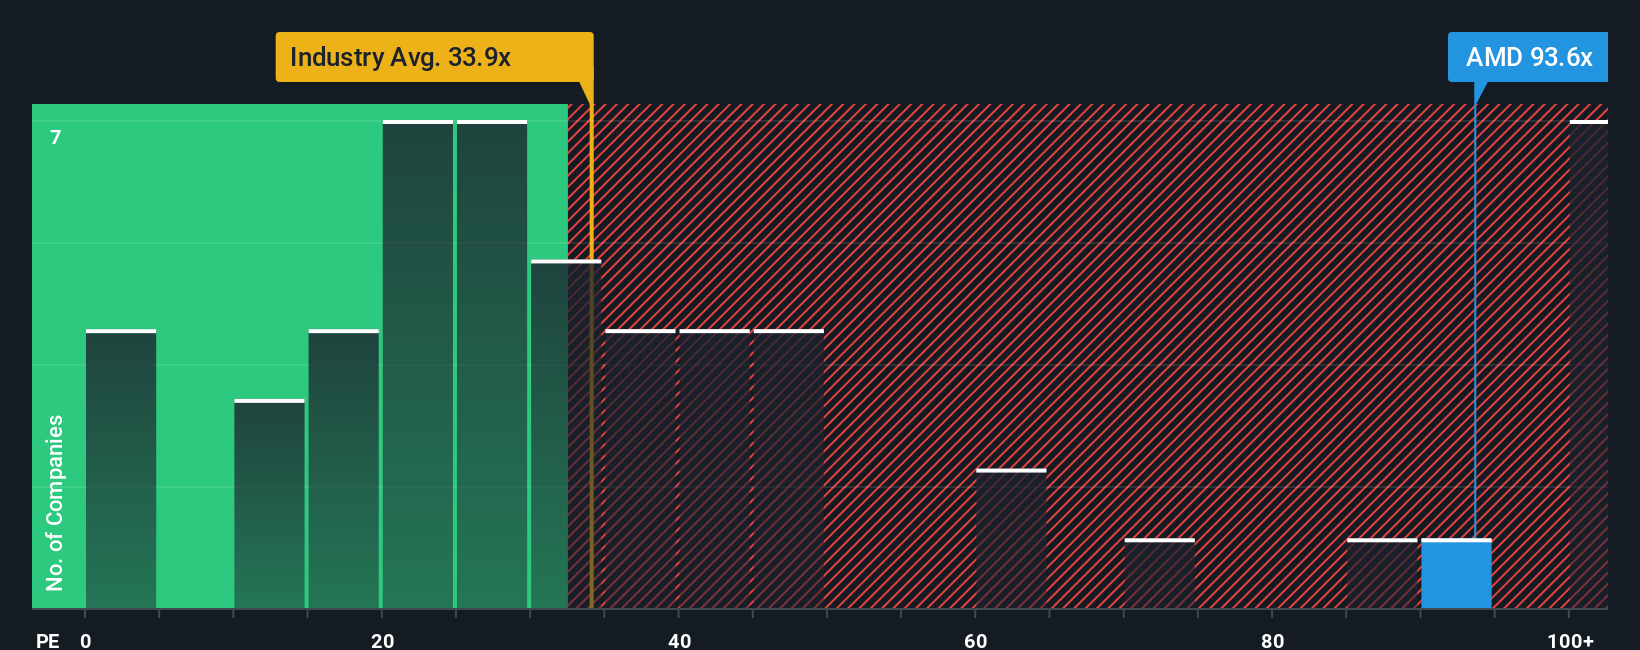
Currently, AMD trades at a PE ratio of 94.8x, which is significantly higher than the semiconductor industry average of 34.9x and the peer average of 33.0x. This suggests the market is expecting substantial future growth from AMD, but also highlights that investors are paying a much higher price for its current earnings compared to its peers.
Simply Wall St's proprietary "Fair Ratio" takes a step beyond basic comparisons by adjusting for factors like earnings growth rates, profit margins, market risk, and company size alongside industry context. For AMD, the Fair Ratio is calculated at 46.9x. This method is more insightful than a simple industry comparison, as it reflects AMD’s specific financial profile and growth outlook rather than assuming all companies in the space are created equal.
With AMD’s actual PE of 94.8x compared to a Fair Ratio of 46.9x, the stock appears to be trading at a considerable premium and is likely overvalued on this basis.
Result: OVERVALUED
Upgrade Your Decision Making: Choose your Advanced Micro Devices Narrative
Earlier we mentioned that there is an even better way to understand valuation, so let us introduce you to Narratives. A Narrative is a personalized story or perspective you create about a company’s future, where you connect what you believe about AMD’s strategy, growth drivers, and industry conditions with your own forecasts for revenue, profit margins, and fair value. Narratives bridge the gap between the company’s unique story and the numbers, linking your outlook to an explicit financial forecast that is mapped directly to a fair value estimate.
On Simply Wall St’s Community page, Narratives make this process simple and accessible for everyone, whether you’re a beginner or advanced. By building or following a Narrative, you can quickly compare your fair value estimate to today’s price and clarify whether it’s time to buy, hold, or sell based on what you believe and see unfolding in the news. Narratives are kept fresh and up to date. When new data comes in, your estimates and fair value get recalculated in real time.
For example, some investors are optimistic and project aggressive AI growth for AMD, resulting in a high fair value above $230 per share. Others remain cautious, factoring in U.S.-China tensions or manufacturing bottlenecks to arrive at much lower valuations just above $130. Narratives let you weigh these viewpoints and decide which story and investment strategy rings truest for you.
For Advanced Micro Devices, we’ll make it really easy for you with previews of two leading Advanced Micro Devices Narratives:
- 🐂 Advanced Micro Devices Bull Case
Fair Value: $180.10
Current Price is 11.5% below fair value
Forecast Revenue Growth: 16.5%
- AMD’s focus on hardware efficiency and aggressive pricing is expected to drive revenue growth and expand market share, particularly in CPUs and low-mid GPU segments.
- The acquisition of Xilinx positions AMD to target the booming AI and Data Center markets. Adaptive computing and AI products are expected to fuel substantial growth.
- Recent results show rapid growth in Data Center and Client segments, suggesting AMD may outperform conservative estimates. The Gaming segment remains a near-term weakness.
- 🐻 Advanced Micro Devices Bear Case
Fair Value: $103.16
Current Price is 54.5% above fair value
Forecast Revenue Growth: 16.0%
- Increasing industry competition, especially with Nvidia and Intel, is expected to force AMD to allocate more revenue to R&D, which could squeeze margins despite growing revenues.
- The current AI investment boom is anticipated to plateau in coming years. This could potentially lead to a cyclical downturn in chip demand by 2027-2028.
- While AMD is participating stronger in AI and Data Center growth than previously projected, long-term valuation assumes lower profitability due to persistent high R&D spend.
This article by Simply Wall St is general in nature. We provide commentary based on historical data and analyst forecasts only using an unbiased methodology and our articles are not intended to be financial advice. It does not constitute a recommendation to buy or sell any stock, and does not take account of your objectives, or your financial situation. We aim to bring you long-term focused analysis driven by fundamental data. Note that our analysis may not factor in the latest price-sensitive company announcements or qualitative material. Simply Wall St has no position in any stocks mentioned.
Have feedback on this article? Concerned about the content? Get in touch with us directly. Alternatively, email editorial-team@simplywallst.com