
Is There Still Growth Ahead for Visa Stock After Latest Earnings Rally?
Thinking about what to do with Visa stock? You are not alone. Whether you are a seasoned investor or someone casually tracking big names in your portfolio, Visa has probably caught your eye with its solid reputation and widespread use. However, recent price movements might have you scratching your head, trying to figure out if now is the right time to buy, hold, or move on.
Visa's share price has dipped slightly over the past week, down 0.4%, and slipped 3.2% over the last month. That is a contrast to the company’s longer-term strength. Year-to-date, the stock is still up 7.7%. Over the last year, it has soared 25%, and if you go back three years, Visa returned nearly 95%. Even over five years, you are looking at a healthy 76% gain. Clearly, Visa has delivered impressive growth for patient investors.
Some of these moves may reflect broader trends in the payments industry, such as heightened focus on digital transactions, regulatory talks in different markets, and the ongoing evolution of consumer finance. But here is the key question: is Visa undervalued now, or maybe even priced at a premium? According to a standard valuation score, Visa checks the box zero out of six times for undervaluation, resulting in a value score of 0. While that might sound alarming, valuation is more nuanced than any one number.
Let’s dive into how different methods measure Visa’s value, and why considering multiple perspectives can help you make an even smarter assessment. There is also a smarter way to think about valuation that I will share near the end, so stay tuned.
Visa scores just 0/6 on our valuation checks. See what other red flags we found in the full valuation breakdown.Approach 1: Visa Excess Returns Analysis
The Excess Returns valuation model focuses on whether a company generates returns on invested capital that exceed its cost of equity. Simply put, this model measures how much value Visa is creating above what shareholders require in returns, taking into account book value and expected earnings strength over time.
For Visa, several key figures stand out. The company’s Book Value per share is $19.58, while its Stable Earnings Per Share is $13.43, based on weighted future Return on Equity estimates from 11 analysts. With a Cost of Equity estimated at $1.53 per share, Visa produces an Excess Return of $11.90 per share. Notably, Visa’s average Return on Equity is an exceptional 65.67%, far surpassing what most companies deliver. The Stable Book Value, weighted by future projections from 7 analysts, is estimated at $20.45 per share.
Based on these inputs, the Excess Returns model estimates the intrinsic value of Visa’s stock at $289.63 per share. Visa’s current share price sits roughly 16.9 percent higher than this intrinsic value, signaling the stock is trading at a notable premium rather than being undervalued. Buyers at this price are paying up for the quality, but the numbers suggest caution if value is your priority.
Result: OVERVALUED
Head to the Valuation section of our Company Report for more details on how we arrive at this Fair Value for Visa.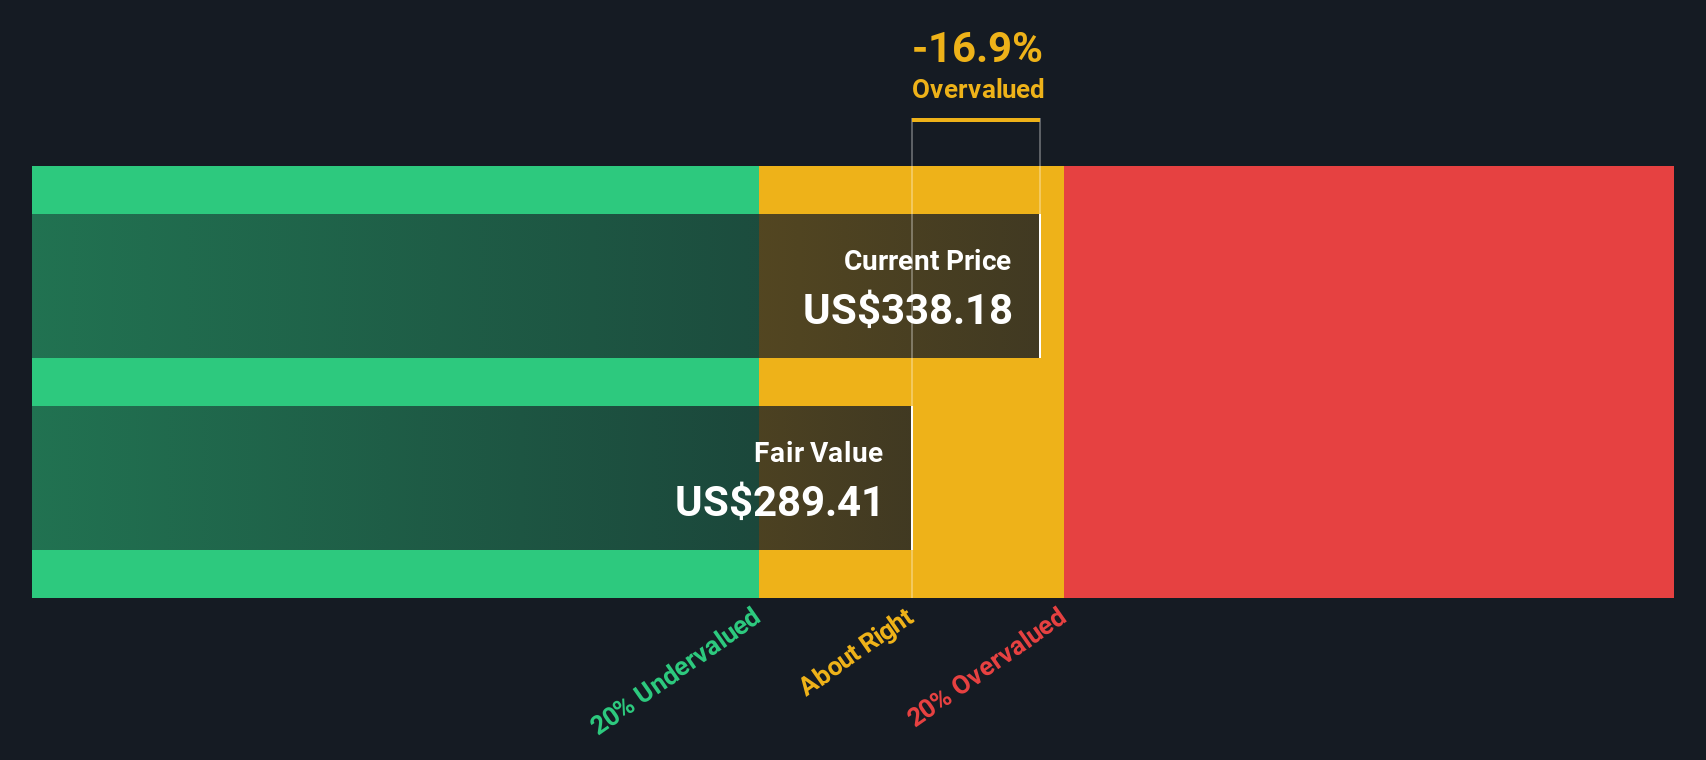
Approach 2: Visa Price vs Earnings
The Price-to-Earnings (PE) ratio is a popular valuation measure for profitable companies like Visa, as it compares the current share price to its per-share earnings. This multiple helps investors judge how much they are paying for one dollar of the company’s earnings, making it especially useful for businesses with a long track record of positive net profits.
Growth prospects and perceived risk both influence what constitutes a “normal” or “fair” PE ratio. Companies expected to deliver strong earnings growth, or perceived as lower risk due to market leadership or resilient business models, generally warrant higher multiples. Conversely, companies with slower growth or higher risk tend to trade at lower PE ratios.
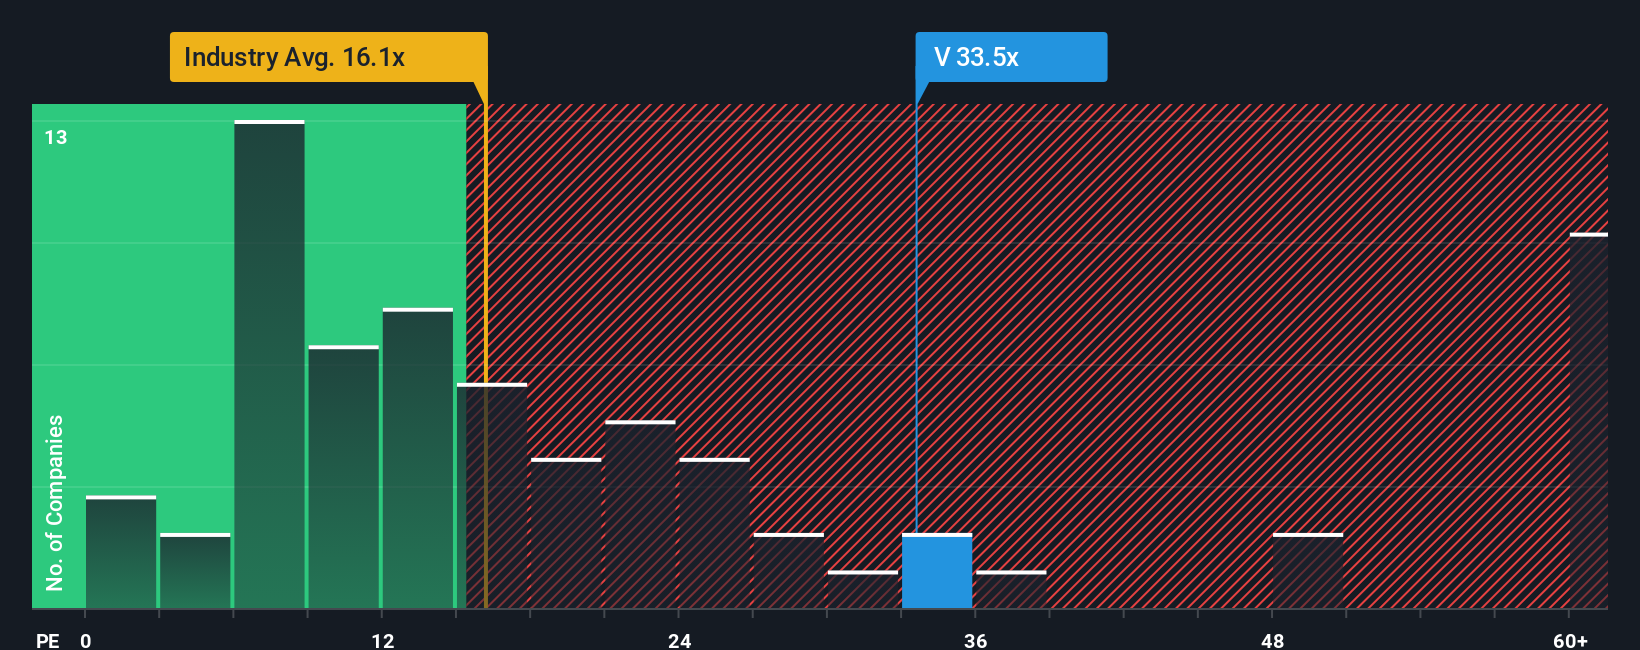
Visa currently trades at a PE ratio of 32.5x, meaning investors are paying $32.50 for every $1 of last year’s earnings. For comparison, the average PE among peers is 22.1x, and the Diversified Financial industry average is even lower at 16.7x. Instead of relying solely on broad industry benchmarks or peer averages, Simply Wall St develops a “Fair Ratio,” which for Visa is 21.3x. This proprietary figure incorporates factors specific to Visa, such as its above-average earnings growth, robust profit margins, market capitalization, as well as the unique risks it faces. This approach results in a tailored benchmark for fair value and offers a more nuanced view than relying on simple peer or industry comparisons.
With Visa’s current PE ratio sitting well above its Fair Ratio (32.5x vs 21.3x), the stock appears overvalued relative to the growth and risk priced into the Fair Ratio.
Result: OVERVALUED
Upgrade Your Decision Making: Choose your Visa Narrative
Earlier, we mentioned there is an even better way to approach valuation, so let's introduce you to Narratives. A Narrative is your story, your own investment thesis, about a company, built around a financial forecast and an estimated fair value. Rather than relying solely on one static valuation number or model, Narratives let you tie together your perspective on Visa’s future revenue, profit margins, key risks, and market opportunities. This connects the company’s story directly to a projected fair value.
This makes investing more dynamic and personal. On Simply Wall St’s Community page, millions of investors easily create and update Narratives, linking news, earnings, or regulatory events to fresh forecasts. Narratives help you compare your calculated fair value to the current share price, empowering confident “buy,” “hold,” or “sell” decisions based on live, scenario-driven thinking.
For example, some investors argue Visa faces margin pressure and anticipate regulatory risks limiting earnings growth, setting a fair value near $243 per share. Others see ongoing global e-commerce trends driving higher future margins and assign fair values above $391. Narratives can quickly evolve as new data emerges, ensuring your outlook remains accurate and actionable.
For Visa, however, we’ll make it really easy for you with previews of two leading Visa Narratives:
🐂 Visa Bull CaseFair Value: $391.46
Currently 13.5% undervalued versus the fair value
Forecast Revenue Growth: 10.1%
- Global e-commerce, emerging market expansion, and digital adoption are driving Visa’s payment volumes and supporting strong long-term revenue growth.
- Value-added services and cross-border solutions are lifting margins and broadening Visa’s revenue streams. Ongoing share buybacks also provide earnings per share growth and downside protection.
- Analysts expect revenue to grow by 10.1% yearly and EPS to rise, with a consensus fair value 12.1% above the recent share price. However, the narrative highlights risks from new payment technology, regulatory changes, and rising competition.
Fair Value: $243.09
Currently 39.4% overvalued versus the fair value
Forecast Revenue Growth: 9.1%
- Visa faces mounting regulatory scrutiny, particularly the risk of the Credit Card Competition Act, which could fundamentally change the company’s fee model and reduce its overall profitability.
- Growth is expected to moderate as Visa reaches market maturity. Headwinds from increased competition, especially in international and B2B cross-border payments, are likely to pressure margins and growth rates.
- The narrative anticipates slowing revenue growth and margin compression, projecting a lower PE multiple. It also highlights that the current share price is well above the estimated fair value despite solid recent earnings.

This article by Simply Wall St is general in nature. We provide commentary based on historical data and analyst forecasts only using an unbiased methodology and our articles are not intended to be financial advice. It does not constitute a recommendation to buy or sell any stock, and does not take account of your objectives, or your financial situation. We aim to bring you long-term focused analysis driven by fundamental data. Note that our analysis may not factor in the latest price-sensitive company announcements or qualitative material. Simply Wall St has no position in any stocks mentioned.
Have feedback on this article? Concerned about the content? Get in touch with us directly. Alternatively, email editorial-team@simplywallst.com