
- PREMIUM
- LIVE QUOTES
- INSTITUTIONS
 Index Options
 State Street
 CME Group
 Nasdaq
 Cboe
Cboe TradingView
 Wall Street Journal
Is the Netflix Rally Sustainable After CPO Kim’s Exit and Recent Box Office Surprise?
Thinking about what to do with Netflix stock right now? You are definitely not alone. Netflix has been on quite the run this year, turning in a powerful year-to-date return of 38.4% and a staggering 74% over the past twelve months. Even if you have been watching from the sidelines, that kind of momentum is hard to ignore. Over a longer horizon, the numbers look even more eye-popping, with Netflix shares up over 447% in three years and 150% in five years. It is no surprise the stock is making many investors rethink what is possible for the streaming giant.
But does all that growth mean Netflix is really undervalued? Recent headlines have sparked even more debate. The company’s chief product officer, Eunice Kim, just announced her unexpected exit, raising some short-term questions. Netflix’s original film "KPop Demon Hunters" surprised many by topping the box office. Add in rumors swirling about major broadcasting deals and competitors like Warner Bros. Discovery angling for new partnerships, and it is clear the market’s outlook is constantly shifting. Despite this backdrop, Netflix only passes 1 out of 6 key checks for undervaluation. According to our value scoring method, that is not exactly screaming "bargain."
All these forces make now a great moment to take a fresh look at Netflix’s valuation. Ahead, I will break down how the company measures up across several popular methods and tease out an even better way to think about valuation that most investors overlook.
Netflix scores just 1/6 on our valuation checks. See what other red flags we found in the full valuation breakdown.Approach 1: Netflix Discounted Cash Flow (DCF) Analysis
The Discounted Cash Flow (DCF) model estimates what a business is worth today by projecting its future cash flows and discounting them back to the present. In Netflix’s case, this method starts with the company’s latest Free Cash Flow (FCF), which stands at $8.6 Billion, and then projects its growth over time based on analyst estimates and further forecasting.
According to current projections, Netflix’s FCF is expected to expand rapidly. Analyst estimates extend to 2029, where FCF is forecast to reach as high as $21.4 Billion. Beyond that, forecasting models continue further, but confidence is highest in the first five years where specific analyst inputs are available. After 2029, Simply Wall St applies its own extrapolated growth rates to continue the trend through 2035.
After discounting these future cash flows back to today’s dollars, the DCF model produces an intrinsic value of $917.49 per share. Compared to where Netflix trades right now, the stock actually appears 33.8% above what the model suggests it is worth. In other words, Netflix comes out as substantially overvalued under this approach.
Result: OVERVALUED
Head to the Valuation section of our Company Report for more details on how we arrive at this Fair Value for Netflix.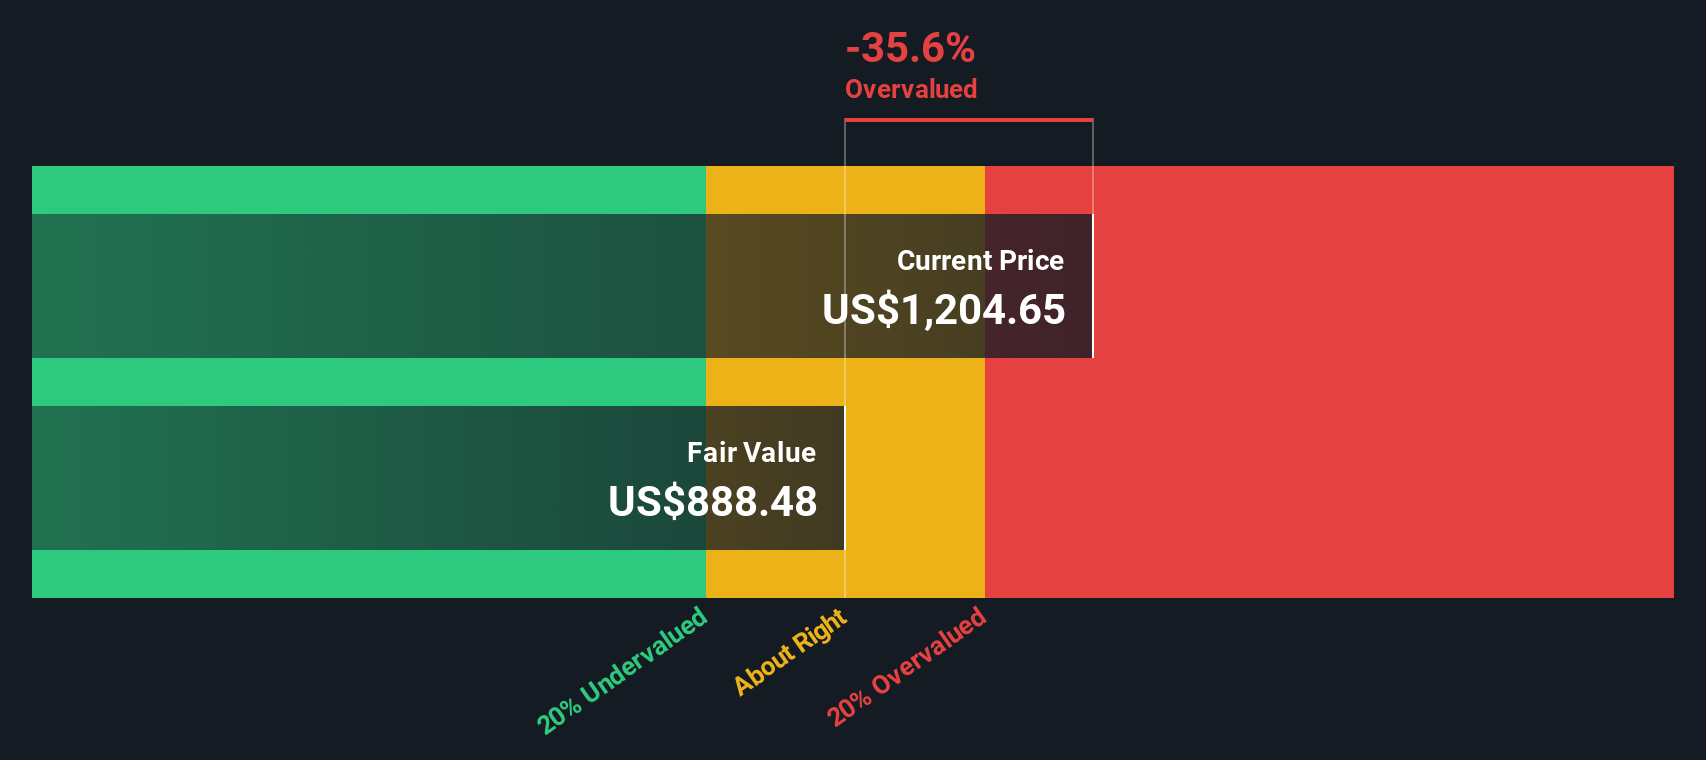
Approach 2: Netflix Price vs Earnings
The Price-to-Earnings (PE) ratio is a favored yardstick for valuing profitable companies like Netflix, because it puts the company’s current stock price in the context of its actual earnings performance. For businesses turning consistent profits, the PE ratio offers a quick way to gauge how much investors are willing to pay for each dollar of earnings.
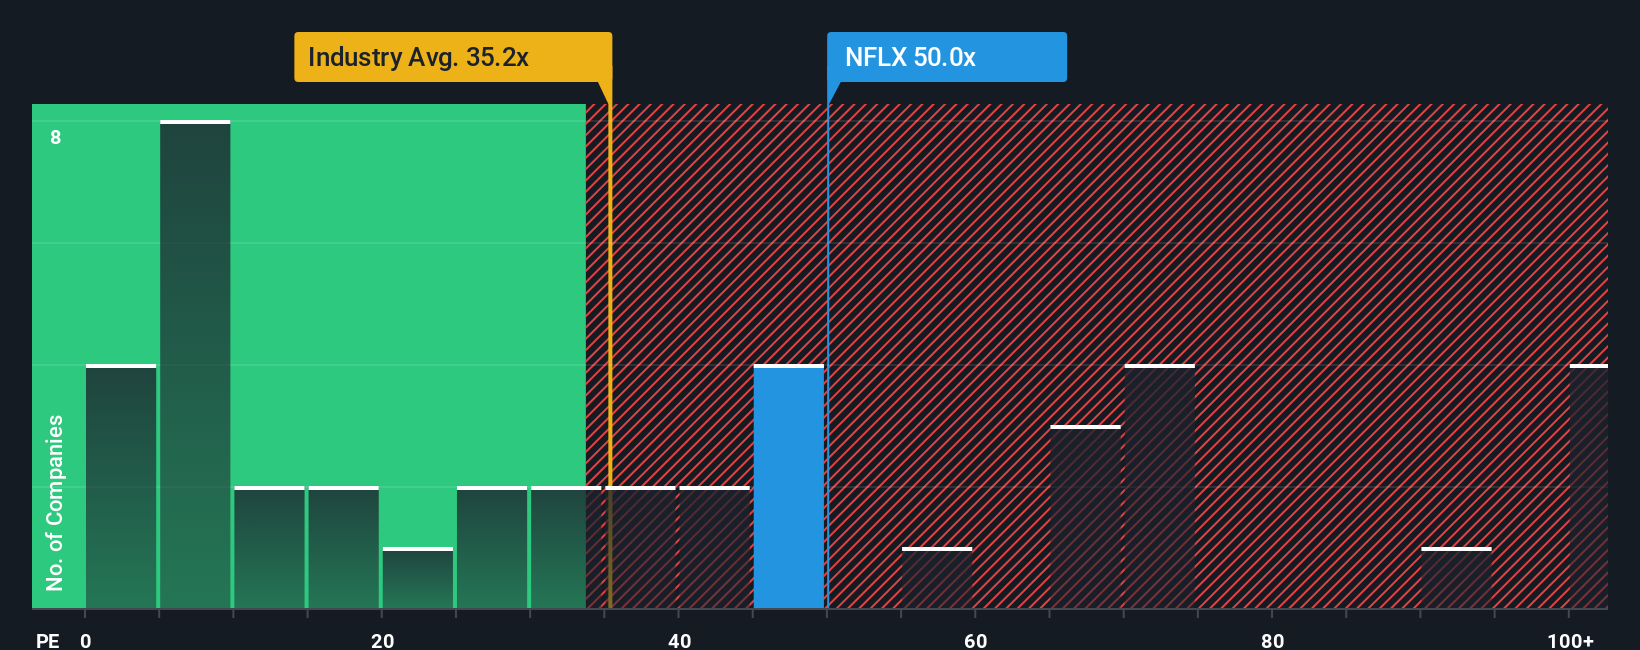
However, what counts as a “fair” PE varies widely. It depends on factors like growth prospects, profitability, and risk. Fast-growing, dominant companies tend to trade at higher PE ratios because investors expect bigger returns down the line, while riskier or slower-growing firms command a discount. For Netflix, the current PE ratio sits at 50.9x. That is noticeably above the entertainment industry average of 32.8x, but below the peer group average of 77.5x.
Simply Wall St’s “Fair Ratio” takes the analysis a step further. Rather than just comparing Netflix to a group of peers or an industry average, the Fair Ratio adjusts for company-specific factors like future earnings growth, profit margins, risks, market cap, and its spot within the media landscape. For Netflix, the Fair Ratio lands at 36.6x. This is lower than its current multiple, signaling the market is pricing in a premium for its growth and position, but perhaps more than is justified by the fundamentals. Because the difference between the Fair Ratio and the current PE is greater than 0.10, Netflix shares appear overvalued by this measure.
Result: OVERVALUED
Upgrade Your Decision Making: Choose your Netflix Narrative
Earlier, we mentioned there is an even better way to understand valuation. Let us introduce you to Narratives. A Narrative is essentially your investment story—a set of informed assumptions and expectations about a company’s future, like its fair value, revenue, and profit margin. Narratives help investors bridge the gap between the numbers and the real business by connecting their personal outlook (whether bullish or cautious) with a concrete financial forecast and, ultimately, a fair value for the stock.
Available on Simply Wall St’s Community page, Narratives are designed to be accessible for all experience levels and are used by millions of investors. By creating or following different Narratives, you can see how shifts in news, earnings, or company announcements instantly update the forecast and assessed fair value. This gives you a dynamic tool for deciding if a stock is fairly priced, overvalued, or undervalued in real time.
For example, one investor might believe Netflix’s new advertising model and international expansion will drive profits to $17.7 billion by 2028, resulting in a bullish fair value of $1,600 per share. Another may view increased competition and slowing user growth as headwinds, supporting a more cautious fair value of $750. This shows there is no single “correct” outlook, just the Narrative that matches your convictions.
For Netflix, however, we will make it really easy for you with previews of two leading Netflix Narratives:
🐂 Netflix Bull CaseFair Value: $1,350.32
Current Discount: 9.1% undervalued
Expected Revenue Growth: 12.5%
- Global rollout of proprietary ad tech and strong international partnerships are set to drive subscriber and revenue growth as Netflix monetizes its ad-supported tier.
- Investments in localized content and generative AI-driven user experience boost engagement, retention, and operational efficiency, supporting expanding profit margins.
- Main risks include intensifying competition, rising content costs, market saturation in mature regions, evolving consumer preferences, and increased regulatory burdens.
Fair Value: $797.74
Current Premium: 53.9% overvalued
Expected Revenue Growth: 13%
- Industry consolidation, Netflix's negotiating leverage, and scale advantages will drive future subscriber growth and margin expansion.
- Ad-supported plans and paid sharing initiatives should decrease churn and increase monetization, while operational discipline improves long-term profitability.
- Risks include overreliance on new initiatives, potential pressure on content costs from strikes, and fierce competition in global entertainment markets.
This article by Simply Wall St is general in nature. We provide commentary based on historical data and analyst forecasts only using an unbiased methodology and our articles are not intended to be financial advice. It does not constitute a recommendation to buy or sell any stock, and does not take account of your objectives, or your financial situation. We aim to bring you long-term focused analysis driven by fundamental data. Note that our analysis may not factor in the latest price-sensitive company announcements or qualitative material. Simply Wall St has no position in any stocks mentioned.
Have feedback on this article? Concerned about the content? Get in touch with us directly. Alternatively, email editorial-team@simplywallst.com