
Does Volvo’s Recent 9% Drop Signal a Long-Term Opportunity in 2025?
If you're sizing up whether to buy, hold, or walk away from AB Volvo stock right now, you're not alone. There is plenty of buzz thanks to its impressive long-term run, with a 128.0% increase over the past five years and a substantial 108.1% gain in the last three. Even more interesting is how the market has digested recent events. After a flat week and a modest year-to-date climb of 1.1%, AB Volvo’s 30-day performance showed a -9.1% dip, suggesting that investor sentiment has been shifting, possibly as risk appetites recalibrate with ongoing market developments around the automotive and industrial sectors.
Despite the recent slide, the company’s fundamentals have caught the eye of many value-seeking investors. AB Volvo scored a 5 out of 6 on a value checklist, showing it is considered undervalued in almost every key aspect professional analysts care about. That is a standout score compared to peers, and it helps explain why the stock has managed to deliver an 11.0% gain over the last twelve months even when the broader market saw plenty of ups and downs. With fresh market context and volatility in play, now is a good time to revisit how we assess the company’s value and to see whether conventional metrics really give us the answers we need. Let’s dive into how the main valuation methods stack up for AB Volvo, and stick around because there might be an even smarter way to look at its true worth.
AB Volvo delivered 11.0% returns over the last year. See how this stacks up to the rest of the Machinery industry.Approach 1: AB Volvo Discounted Cash Flow (DCF) Analysis
The Discounted Cash Flow (DCF) model is a standard method for estimating a company's true value by projecting future cash flows and discounting them back to the present. For AB Volvo, this approach starts with its latest reported Free Cash Flow (FCF) of nearly SEK 22.5 billion. Analysts have provided detailed projections for the next five years, and these figures are further extrapolated out to ten years by Simply Wall St to account for ongoing growth beyond analyst forecasts.
According to the most recent FCF projections, AB Volvo’s annual cash flow is expected to almost double over the next decade, reaching an estimated SEK 54.6 billion by 2035. This consistent growth in free cash flow, all denominated in SEK, forms the basis for calculating the present value of the company using the DCF method.
When these future cash flows are discounted appropriately, the resulting estimated intrinsic value comes out to SEK 409.70 per share. Compared to the current trading price, the model implies that AB Volvo’s stock is trading at a substantial 33.4% discount to its fair value. This indicates meaningful upside potential for investors.
Result: UNDERVALUED
Head to the Valuation section of our Company Report for more details on how we arrive at this Fair Value for AB Volvo.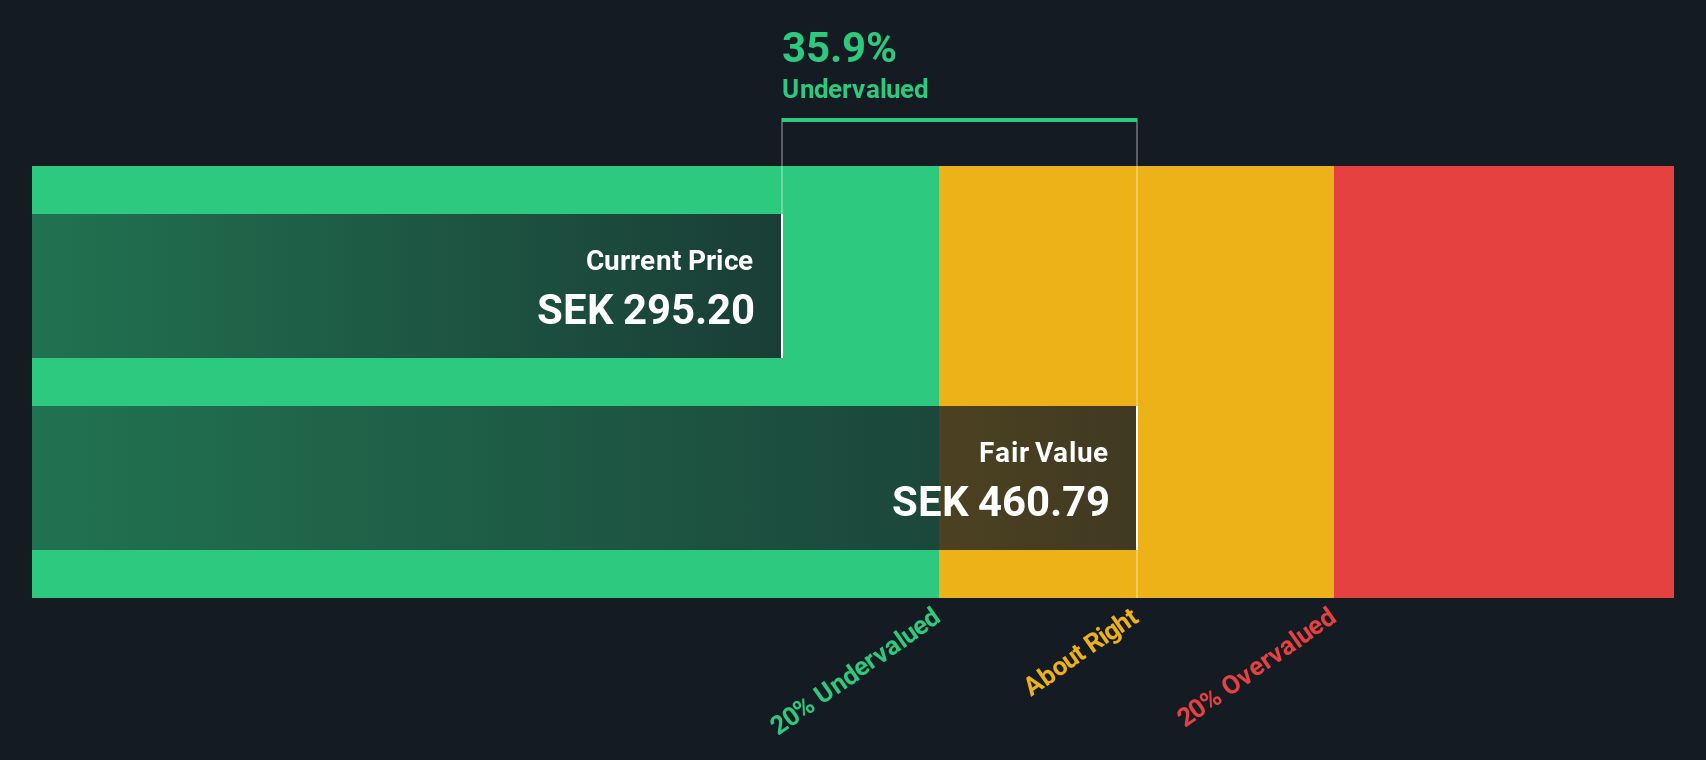
Approach 2: AB Volvo Price vs Earnings
The Price-to-Earnings (PE) ratio is a widely recognized valuation metric for profitable companies, like AB Volvo, because it directly connects a company’s market value with its actual earnings performance. Investors favor the PE ratio when a business is generating consistent profits, as it provides a quick snapshot of how much investors are willing to pay for each unit of earnings.
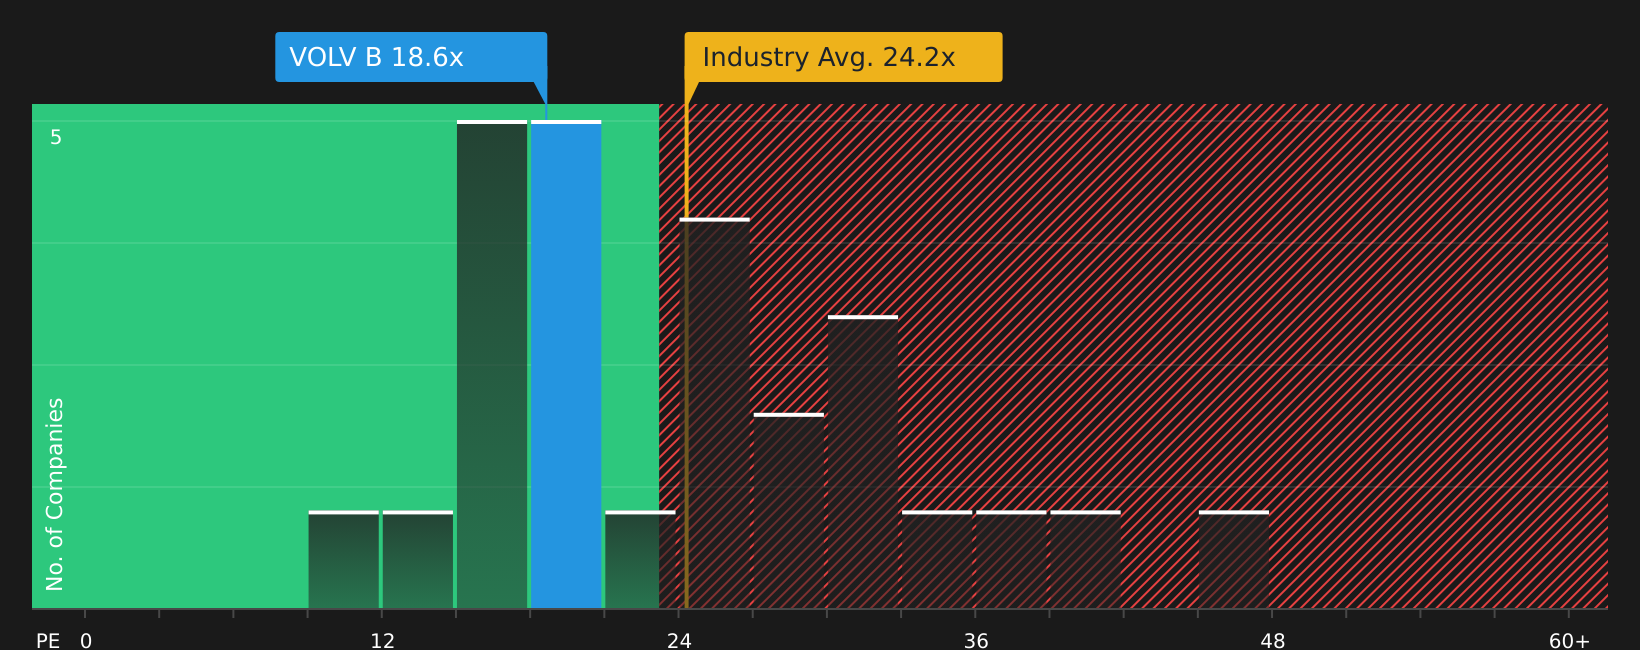
Growth expectations and risk levels play a big part in what’s considered a reasonable, or “fair,” PE ratio. Fast-growing or lower-risk companies tend to command higher PE multiples, while slower-growing or riskier firms usually trade at lower ones. For AB Volvo, the current PE ratio stands at 14.58x, which is considerably lower than the Machinery industry average of 24.72x and the peer group average of 31.75x. This comparison makes AB Volvo appear attractively valued at first glance.
To get a sharper read, we apply Simply Wall St’s proprietary “Fair Ratio.” This custom metric refines the benchmark by factoring in elements beyond just industry norms, including AB Volvo’s earnings growth trajectory, profit margins, market capitalization, and risk profile. Unlike a generic industry or peer comparison, the Fair Ratio is designed to reflect the unique circumstances facing AB Volvo. For this company, the calculated Fair Ratio is 30.85x, which is substantially above its current PE ratio.
Since AB Volvo is trading at a much lower PE multiple than its Fair Ratio, this suggests the stock may be meaningfully undervalued using this lens.
Result: UNDERVALUED
Upgrade Your Decision Making: Choose your AB Volvo Narrative
Earlier we mentioned that there is an even better way to understand valuation, so let's introduce you to Narratives. A Narrative is your unique story about a company, where you link your personal expectations and beliefs about AB Volvo's future to the numbers, including your estimates for future revenue, earnings, and fair value.
Unlike static models, a Narrative helps you connect the “why” behind your valuation. You create a financial forecast grounded in a real story, which is then translated into a fair value. Narratives make decision making easier by showing you, right on Simply Wall St’s Community page, how your outlook compares to the current price. This helps you confidently decide whether to buy, hold, or sell.
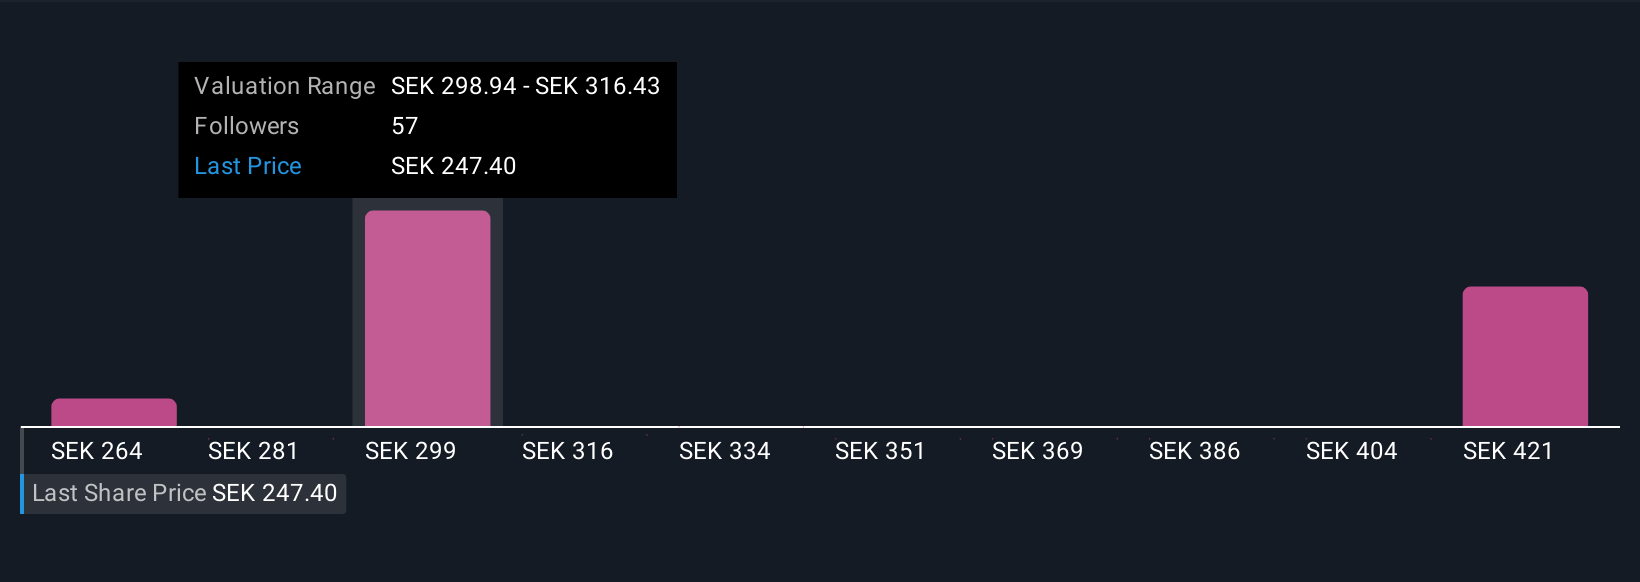
This approach is not only easy and visual, but also dynamic. As new company results or news emerge, Simply Wall St updates Narratives in real time, so your story remains relevant. For example, some investors currently see fair value for AB Volvo as low as SEK 270, while others believe it is as high as SEK 439, reflecting how personal perspectives and updated information shape these investment stories.
For AB Volvo, we’ll make it really easy for you with previews of two leading AB Volvo Narratives:
- 🐂 AB Volvo Bull Case
Fair Value: SEK 438.8
AB Volvo is currently 37.9% below this fair value estimate
Revenue Growth Forecast: 5.0%
- Sees Volvo expanding leadership in electric and autonomous vehicles, supported by robust demand, high-margin services, and strong order books.
- Highlights growth from subscription-based software, aftermarket, and emerging markets, with a focus on sustainability and circular economy.
- Forecasts margin expansion and considers AB Volvo slightly undervalued today, if electrification and service growth continue as expected.
- 🐻 AB Volvo Bear Case
Fair Value: SEK 270.0
AB Volvo is currently 1.0% above this fair value estimate
Revenue Growth Forecast: 8.27%
- Considers Volvo undervalued but only modestly so, with a price target just below the current share price.
- Focuses on reliable dividend yield, stable growth, and cautious optimism given supply chain and industry headwinds.
- Sees steady execution on EV transition and dividend sustainability, but views the upside as limited in the near term.
This article by Simply Wall St is general in nature. We provide commentary based on historical data and analyst forecasts only using an unbiased methodology and our articles are not intended to be financial advice. It does not constitute a recommendation to buy or sell any stock, and does not take account of your objectives, or your financial situation. We aim to bring you long-term focused analysis driven by fundamental data. Note that our analysis may not factor in the latest price-sensitive company announcements or qualitative material. Simply Wall St has no position in any stocks mentioned.
Have feedback on this article? Concerned about the content? Get in touch with us directly. Alternatively, email editorial-team@simplywallst.com