
Scope Fluidics S.A.'s (WSE:SCP) 11% gain last week benefited both retail investors who own 49% as well as insiders
Key Insights
- The considerable ownership by retail investors in Scope Fluidics indicates that they collectively have a greater say in management and business strategy
- 50% of the business is held by the top 6 shareholders
- Insiders own 27% of Scope Fluidics
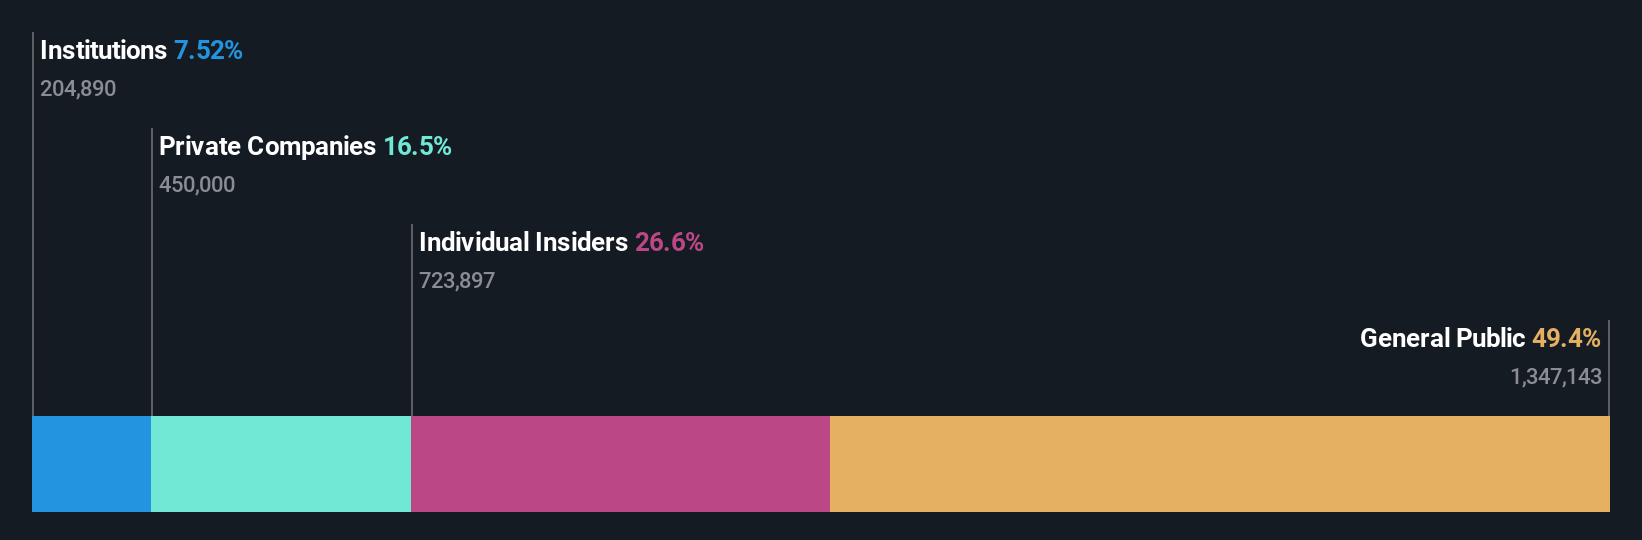
To get a sense of who is truly in control of Scope Fluidics S.A. (WSE:SCP), it is important to understand the ownership structure of the business. We can see that retail investors own the lion's share in the company with 49% ownership. Put another way, the group faces the maximum upside potential (or downside risk).
While retail investors were the group that benefitted the most from last week’s zł46m market cap gain, insiders too had a 27% share in those profits.
Let's delve deeper into each type of owner of Scope Fluidics, beginning with the chart below.
View our latest analysis for Scope Fluidics
What Does The Institutional Ownership Tell Us About Scope Fluidics?
Institutional investors commonly compare their own returns to the returns of a commonly followed index. So they generally do consider buying larger companies that are included in the relevant benchmark index.
As you can see, institutional investors have a fair amount of stake in Scope Fluidics. This can indicate that the company has a certain degree of credibility in the investment community. However, it is best to be wary of relying on the supposed validation that comes with institutional investors. They too, get it wrong sometimes. It is not uncommon to see a big share price drop if two large institutional investors try to sell out of a stock at the same time. So it is worth checking the past earnings trajectory of Scope Fluidics, (below). Of course, keep in mind that there are other factors to consider, too.

We note that hedge funds don't have a meaningful investment in Scope Fluidics. TTL 1 SP Z O O is currently the company's largest shareholder with 17% of shares outstanding. For context, the second largest shareholder holds about 13% of the shares outstanding, followed by an ownership of 13% by the third-largest shareholder. Piotr Garstecki, who is the second-largest shareholder, also happens to hold the title of Chief Executive Officer.
On further inspection, we found that more than half the company's shares are owned by the top 6 shareholders, suggesting that the interests of the larger shareholders are balanced out to an extent by the smaller ones.
While it makes sense to study institutional ownership data for a company, it also makes sense to study analyst sentiments to know which way the wind is blowing. There is some analyst coverage of the stock, but it could still become more well known, with time.
Insider Ownership Of Scope Fluidics
The definition of company insiders can be subjective and does vary between jurisdictions. Our data reflects individual insiders, capturing board members at the very least. The company management answer to the board and the latter should represent the interests of shareholders. Notably, sometimes top-level managers are on the board themselves.
Most consider insider ownership a positive because it can indicate the board is well aligned with other shareholders. However, on some occasions too much power is concentrated within this group.
It seems insiders own a significant proportion of Scope Fluidics S.A.. Insiders own zł123m worth of shares in the zł463m company. It is great to see insiders so invested in the business. It might be worth checking if those insiders have been buying recently.
General Public Ownership
The general public, who are usually individual investors, hold a 49% stake in Scope Fluidics. While this group can't necessarily call the shots, it can certainly have a real influence on how the company is run.
Private Company Ownership
It seems that Private Companies own 17%, of the Scope Fluidics stock. It's hard to draw any conclusions from this fact alone, so its worth looking into who owns those private companies. Sometimes insiders or other related parties have an interest in shares in a public company through a separate private company.
Next Steps:
It's always worth thinking about the different groups who own shares in a company. But to understand Scope Fluidics better, we need to consider many other factors. Like risks, for instance. Every company has them, and we've spotted 2 warning signs for Scope Fluidics (of which 1 is concerning!) you should know about.
If you are like me, you may want to think about whether this company will grow or shrink. Luckily, you can check this free report showing analyst forecasts for its future.
NB: Figures in this article are calculated using data from the last twelve months, which refer to the 12-month period ending on the last date of the month the financial statement is dated. This may not be consistent with full year annual report figures.
Have feedback on this article? Concerned about the content? Get in touch with us directly. Alternatively, email editorial-team (at) simplywallst.com.
This article by Simply Wall St is general in nature. We provide commentary based on historical data and analyst forecasts only using an unbiased methodology and our articles are not intended to be financial advice. It does not constitute a recommendation to buy or sell any stock, and does not take account of your objectives, or your financial situation. We aim to bring you long-term focused analysis driven by fundamental data. Note that our analysis may not factor in the latest price-sensitive company announcements or qualitative material. Simply Wall St has no position in any stocks mentioned.