
- PREMIUM
- LIVE QUOTES
- INSTITUTIONS
 Index Options
 State Street
 CME Group
 Nasdaq
 Cboe
Cboe TradingView
 Wall Street Journal
Is RTX Fairly Priced After Trump Eases Restrictions on Global Drone Sales?
Thinking about what to do with RTX stock? You are not alone. As one of the biggest names in the defense and aerospace sector, RTX has been on a lot of investors’ watchlists, and for good reason. With its impressive year-to-date jump of 34.3% and a massive 192.2% return over the last five years, RTX has captured headlines and portfolios alike. Even just in the past month, shares have continued their steady climb, gaining another 1.1%. That is after a full year of 33.4% upside. Clearly, something is fueling this momentum.
So what is driving all of this action? Recent headlines offer some clues. Moves in Washington, such as talk of easing restrictions on international drone sales, could mean a boom in demand for advanced U.S. military technology, and RTX is right in the middle of it. At the same time, global supply chain pressures, especially China’s ramped-up control over critical minerals, have added both complexity and shine to industry giants that can nimbly navigate this new landscape. In today’s world, investor sentiment on RTX seems to toggle between optimism about future growth and questions about risk.
But does all this excitement actually make RTX undervalued, fairly priced, or even expensive? Our quick value check, based on six commonly used valuation methods, gives RTX a score of 1. This means it only stacks up as undervalued on one of the six main metrics. Still, numbers only tell half the story. In the next section, we will dive deep into the details of each valuation approach, and at the end, we will share a more insightful way to think about whether RTX deserves a spot in your portfolio.
RTX scores just 1/6 on our valuation checks. See what other red flags we found in the full valuation breakdown.Approach 1: RTX Discounted Cash Flow (DCF) Analysis
A Discounted Cash Flow (DCF) model works by estimating the future cash flows a company will generate and then discounting these projections back to today’s value. This technique aims to reveal what a business is truly worth if you owned all its expected future profits right now.
For RTX, the current Free Cash Flow is $2.4 Billion. Analysts have provided estimates up to five years out, with the company projected to generate $10.6 Billion in Free Cash Flow by the end of 2029. Beyond these analyst estimates, projections are extrapolated using historical and industry data to complete a ten-year forecast, all expressed in US Dollars.
According to the 2 Stage Free Cash Flow to Equity model, RTX's calculated intrinsic value comes to $128.15 per share. However, there is a key finding: the current share price stands about 21.6% above this fair value, signaling that RTX is overvalued based on future cash flow expectations.
Result: OVERVALUED
Head to the Valuation section of our Company Report for more details on how we arrive at this Fair Value for RTX.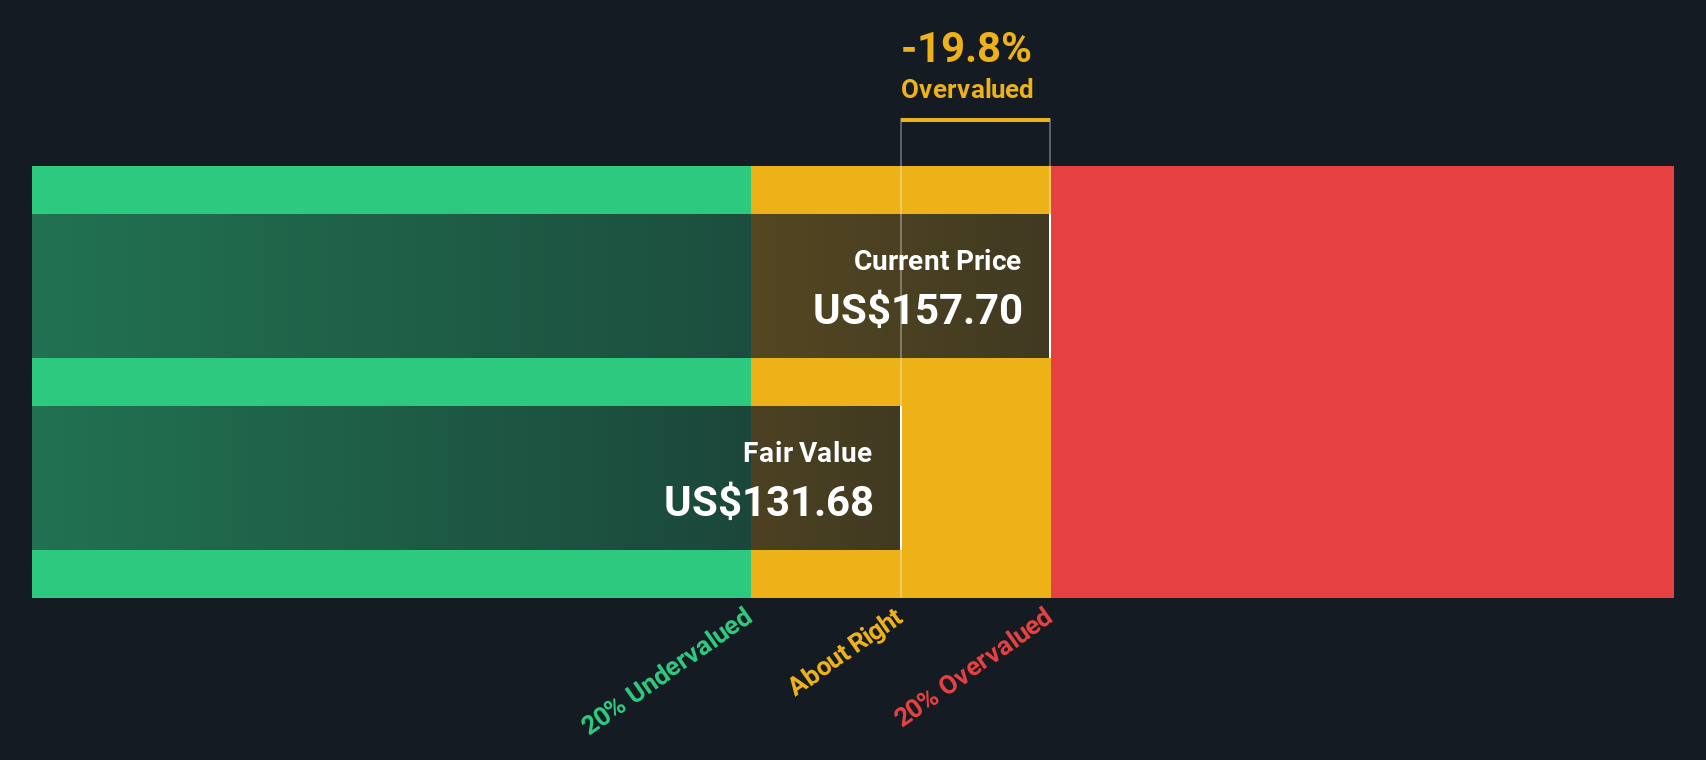
Approach 2: RTX Price vs Earnings
The Price-to-Earnings (PE) ratio is a widely used valuation metric, especially for companies that consistently earn profits like RTX. This multiple tells investors how much they are paying for each dollar of current earnings and serves as a helpful yardstick for comparing companies with similar business models and profit reliability.
What is considered a “fair” PE ratio greatly depends on the market’s growth expectations for the company as well as its risk profile. A higher growth rate or lower risk environment can justify a higher PE. If risks are elevated or growth looks uncertain, investors will typically demand a lower PE multiple.
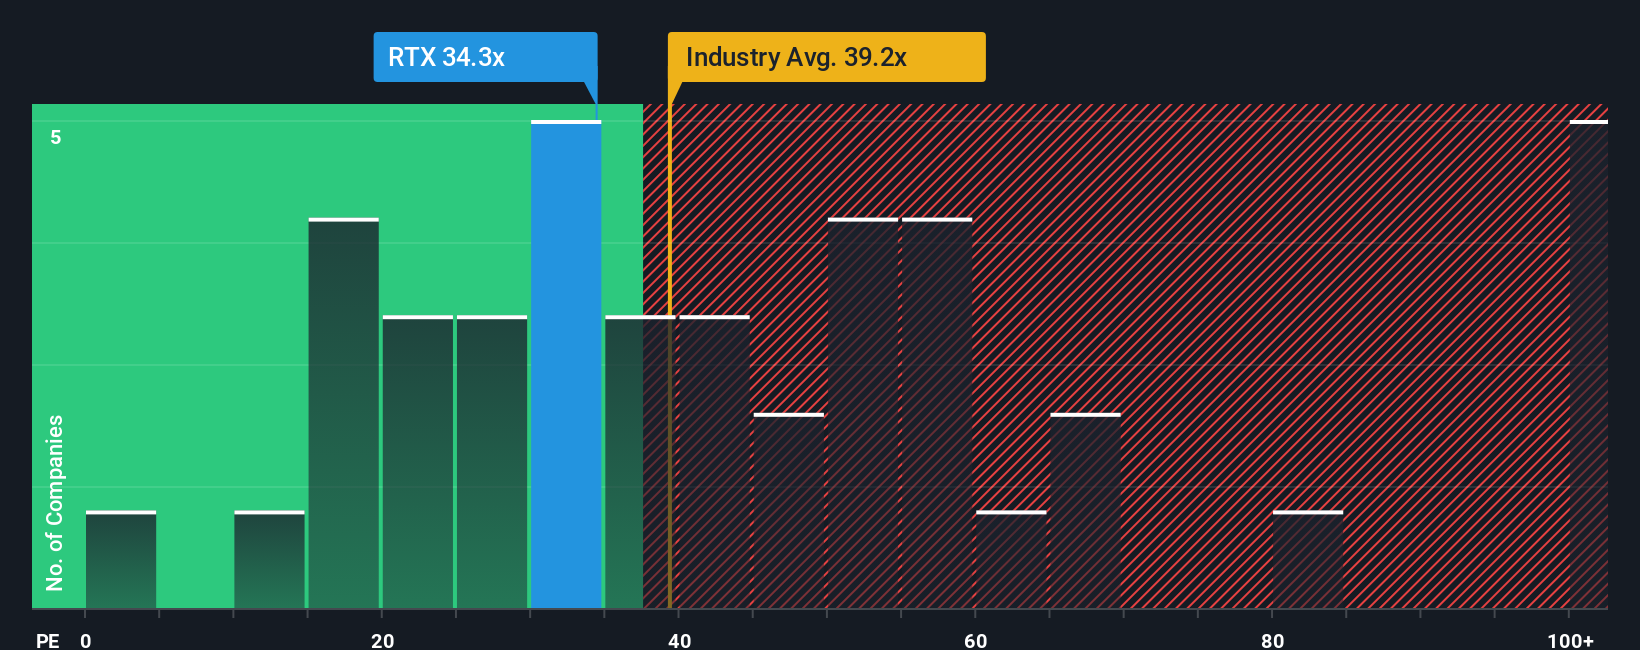
RTX currently trades at a PE of 33.9x. For reference, the Aerospace & Defense industry averages a PE of 34.7x, while RTX’s peers trade at an average of 27.0x. To offer a more tailored comparison, Simply Wall St’s proprietary “Fair Ratio” comes in at 32.4x for RTX. This Fair Ratio is more insightful than a simple industry or peer comparison because it accounts for the company’s specific growth outlook, profit margins, size, industry nuances, and risk factors, providing a more holistic benchmark.
When comparing RTX’s actual PE of 33.9x to its Fair Ratio of 32.4x, the valuation aligns closely with what is reasonable for its profile, indicating the shares are priced about right at the moment.
Result: ABOUT RIGHT
Upgrade Your Decision Making: Choose your RTX Narrative
Earlier we mentioned that there is an even better way to understand valuation, so let us introduce you to Narratives. A Narrative is simply a story that you, or any investor, creates about a company like RTX. It combines your own view of the business and industry drivers with specific financial forecasts, such as revenue growth, profit margins, and fair value.
Unlike classic valuation metrics, Narratives connect the dots between what is happening in the real world, your assumptions and expectations, and a calculated fair value for the company. This makes it much easier and more personal to decide if RTX is a “buy,” “hold,” or “sell” for you.
On Simply Wall St, millions of users now share and update their Narratives on the RTX Community page. This accessible tool lets you see how various investors are interpreting news and forecasts as they happen. In addition, each Narrative is kept current and automatically updates as new earnings, analyst reports, or big headlines come in.
For example, different investors might see RTX’s fair value as high as $180 (if they expect strong defense spending, margin expansion, and new contract wins) or as low as $134 (if they are more cautious about sector risks and cost pressures), showing just how much perspectives can differ and allowing you to choose the version that fits your outlook best.
Do you think there's more to the story for RTX? Create your own Narrative to let the Community know!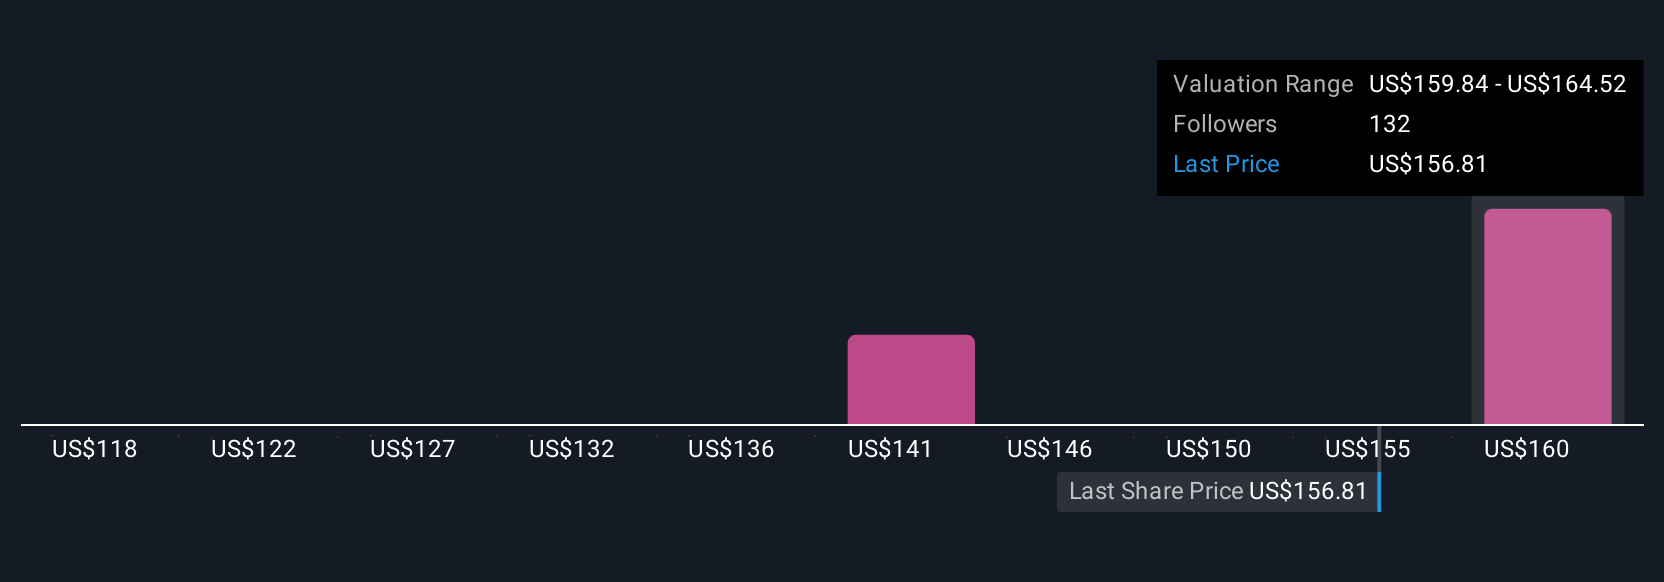
This article by Simply Wall St is general in nature. We provide commentary based on historical data and analyst forecasts only using an unbiased methodology and our articles are not intended to be financial advice. It does not constitute a recommendation to buy or sell any stock, and does not take account of your objectives, or your financial situation. We aim to bring you long-term focused analysis driven by fundamental data. Note that our analysis may not factor in the latest price-sensitive company announcements or qualitative material. Simply Wall St has no position in any stocks mentioned.
Have feedback on this article? Concerned about the content? Get in touch with us directly. Alternatively, email editorial-team@simplywallst.com