
Does Volvo’s Recent Market Pullback Offer a New Entry Opportunity in 2025?
If you have been following AB Volvo lately, you might be finding yourself at a crossroads: is now the right time to jump in, hold, or take some profits? Watching the stock move can feel a little like riding in one of the company’s trucks—solid most of the way, but with the occasional bump in the road to keep things interesting. Over the last five years, AB Volvo’s stock has climbed an impressive 135.3%. Even over the last year, it has delivered a respectable 14.6% return, outpacing much of the broader market. The start of 2024 was a bit more muted, up just 1.4% year-to-date, but that comes after nearly doubling over the prior three years.
Despite its long-term upward momentum, AB Volvo has taken a bit of a pause recently, dipping -1.2% in the last week and -6.8% over the past month. These short-term moves are not uncommon given ongoing shifts in the global markets and changing investor perceptions around industrial stocks. Lately, the broader economic mood has tilted toward cautious optimism, especially with infrastructure trends and the global push for more sustainable transport options. Both of these factors position Volvo well for continued relevance and growth.
Of course, none of this matters if the price you pay for the stock isn’t backed up by solid value. According to our six-point valuation checklist, AB Volvo scores 5 out of 6, marking it as undervalued in all but one area. Before you make a decision, let’s dig deeper into those valuation methods, and stick around because there is one even more insightful way to gauge AB Volvo’s real worth that we will explore at the end.
AB Volvo delivered 14.6% returns over the last year. See how this stacks up to the rest of the Machinery industry.Approach 1: AB Volvo Discounted Cash Flow (DCF) Analysis
The Discounted Cash Flow (DCF) model is a widely used valuation method that projects a company's future free cash flows and then discounts them back to today's value. This provides an estimate of what the business is truly worth right now. This approach is especially helpful for assessing companies with stable and predictable cash generation, like AB Volvo.
For AB Volvo, the DCF analysis starts with its most recent twelve-month Free Cash Flow of SEK 22.5 Billion. Analysts provide explicit Free Cash Flow estimates up to five years out, with further projections extrapolated to estimate long-term trends. Looking ahead to 2029, AB Volvo’s Free Cash Flow is projected to reach SEK 47.1 Billion. By 2035, extrapolated estimates suggest more than SEK 54.6 Billion in Free Cash Flow each year. This steady growth in cash generation highlights the company's robust operating performance and ongoing prospects in the Machinery sector.
Based on these projections, the DCF model estimates AB Volvo’s intrinsic value at SEK 412.83 per share. Compared to the current share price, this valuation suggests the stock is 33.7% undervalued, indicating a significant discount from its fundamental worth.
Result: UNDERVALUED
Head to the Valuation section of our Company Report for more details on how we arrive at this Fair Value for AB Volvo.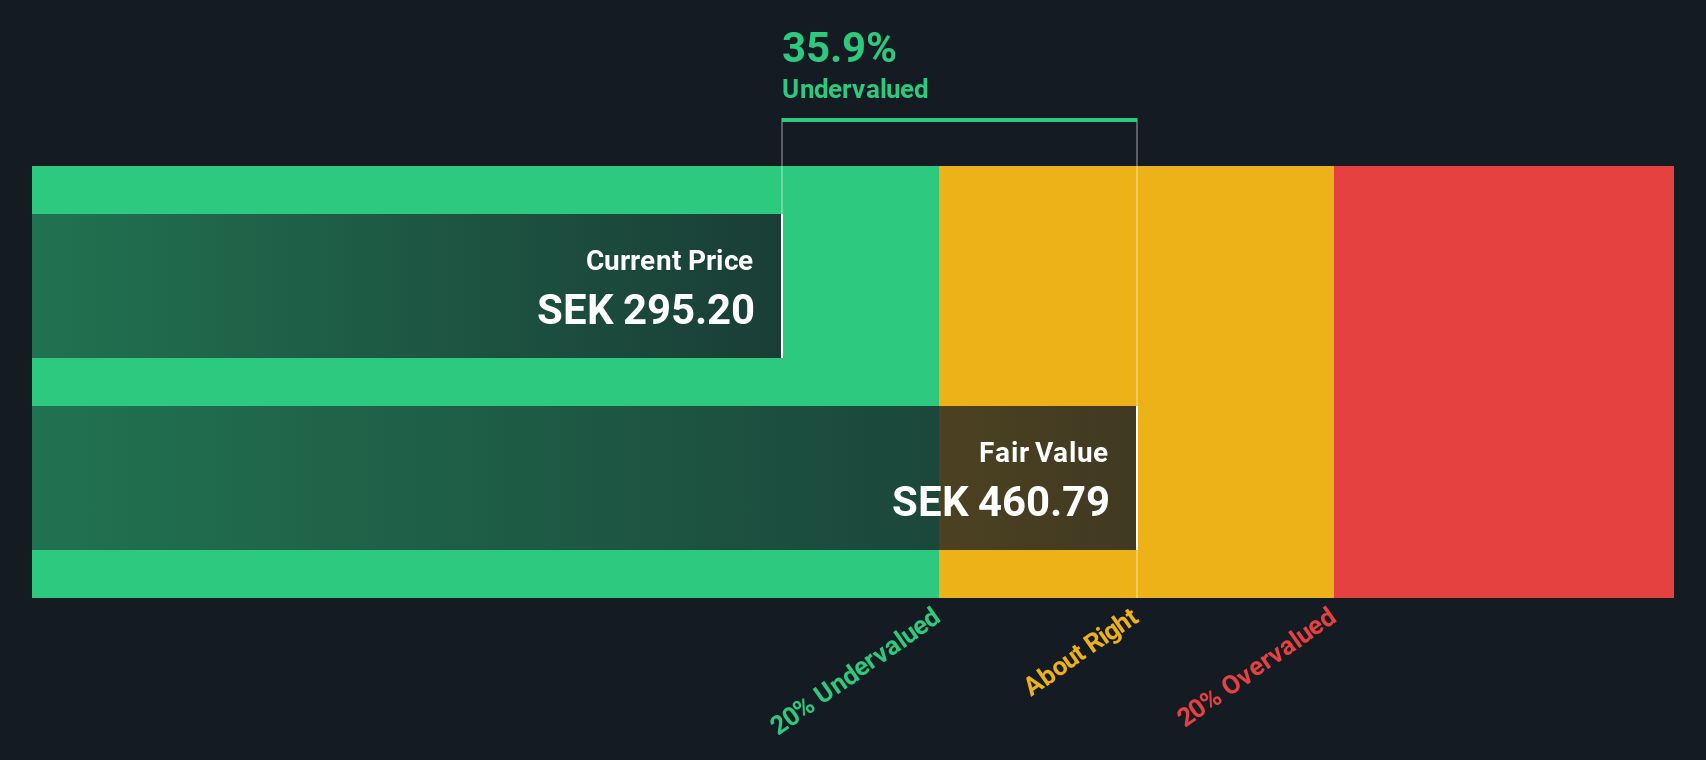
Approach 2: AB Volvo Price vs Earnings
The Price-to-Earnings (PE) ratio is a favored valuation tool for profitable companies like AB Volvo because it links the company’s share price to its actual earnings. This makes it a useful shorthand for how much investors are willing to pay for each unit of profit, providing a clear sense of whether the stock is trading at a premium or a discount relative to expectations.
What is considered a "normal" or "fair" PE ratio depends on factors such as the company’s earnings growth prospects, the stability of those earnings, and the risks tied to the business or industry. Higher expected growth and lower risk generally justify a higher PE ratio, while slower growth and higher risk tend to lower it.
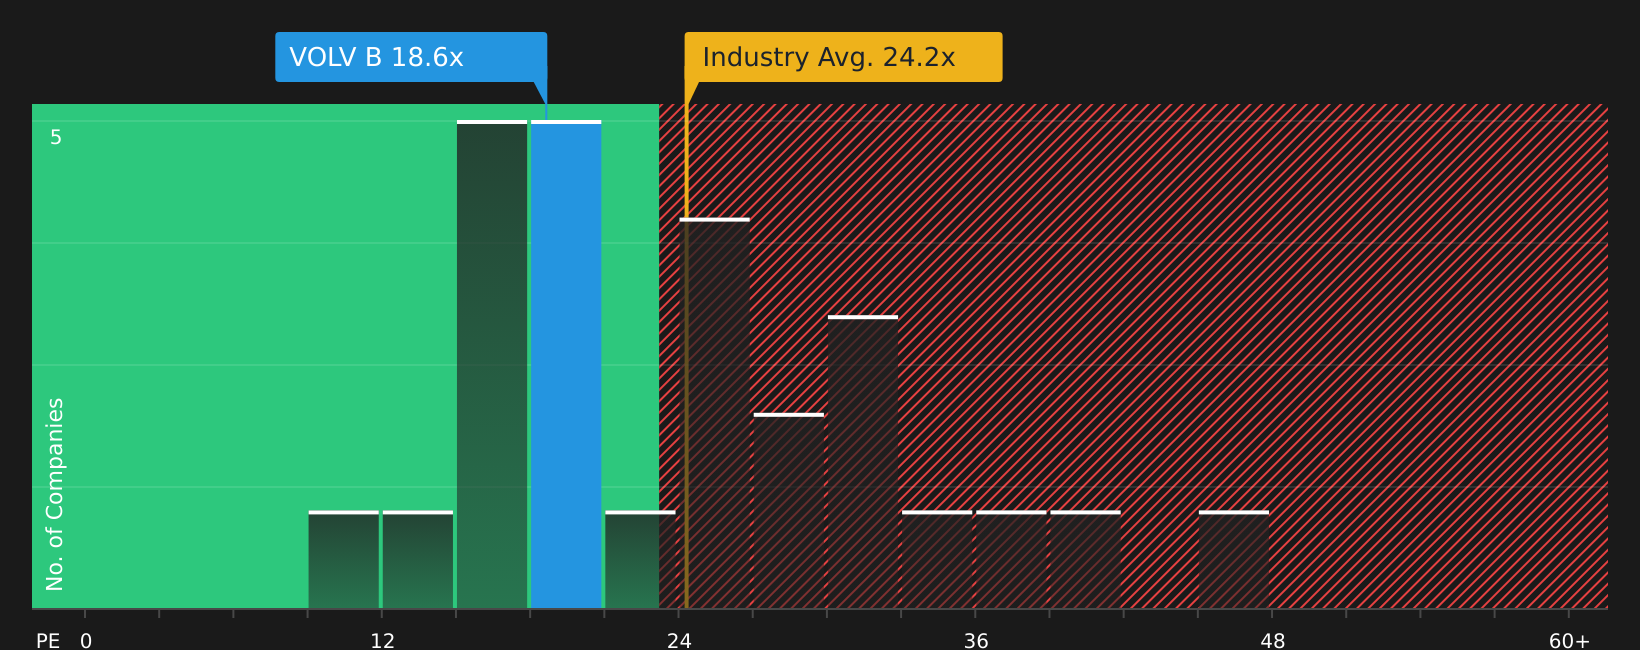
Currently, AB Volvo trades on a PE ratio of 14.6x. This is noticeably below the industry average of 24.6x and peers sitting around 32x. At first glance, this makes Volvo appear attractively priced. However, using Simply Wall St’s Fair Ratio, a proprietary metric that blends earnings growth, profit margins, market cap, industry characteristics, and risk factors, a fair PE for Volvo is 30.9x. Unlike a basic industry or peer comparison, the Fair Ratio provides a more nuanced, company-specific view, ensuring factors unique to AB Volvo are captured in the assessment.
Since the fair PE ratio of 30.9x is more than double the company’s current PE of 14.6x, it suggests AB Volvo’s shares remain significantly undervalued, even after accounting for future risks and growth.
Result: UNDERVALUED
Upgrade Your Decision Making: Choose your AB Volvo Narrative
Earlier, we mentioned there is an even better way to understand valuation, so let's introduce you to Narratives. A Narrative is your story behind a company, connecting your perspective and expectations about AB Volvo, such as its future revenue, earnings, and margins, to a financial forecast and a personalized fair value. Narratives help cut through the noise by linking the company's journey to numbers that you can adjust, so you see how your unique view translates into actionable insights for investing.
Accessible to everyone on Simply Wall St’s Community page, Narratives are an easy-to-use tool relied on by millions of investors. They allow you to visualize whether it makes more sense to buy, hold, or sell, by instantly comparing your Fair Value to the current market price. Importantly, these Narratives stay up to date with every new development, such as earnings reports or major Volvo news, ensuring your outlook remains relevant.
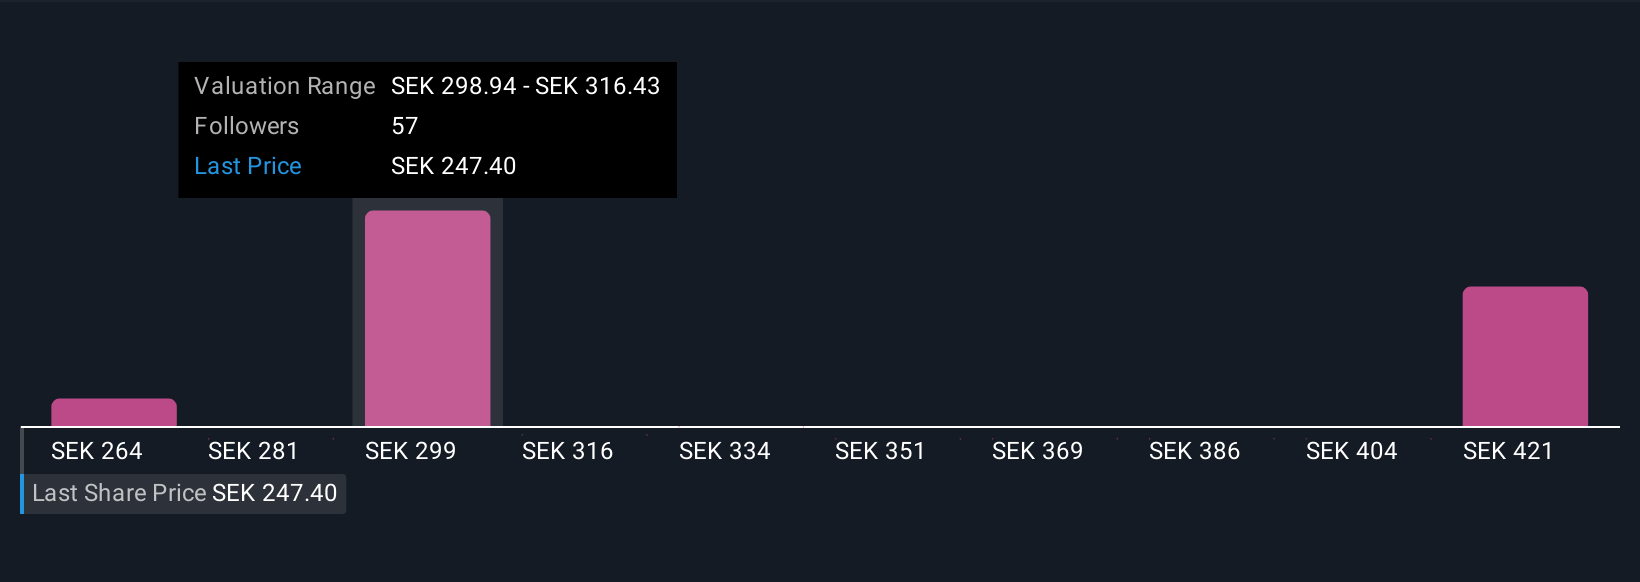
For example, among current Narratives on AB Volvo, some investors see a fair value close to SEK 240 and approach Volvo more cautiously, while others, using more optimistic forecasts, believe its fair value pushes above SEK 430. This illustrates how your unique story about Volvo can shape your investment decisions.
For AB Volvo, we’ll make it straightforward for you with previews of two leading AB Volvo Narratives:
🐂 AB Volvo Bull CaseFair Value: SEK 438.80
Undervalued by: -37.7%
Revenue Growth Rate: 5%
- Anticipates leadership in electric and autonomous heavy vehicles, with investments in AI and global expansion expected to drive recurring revenue and market share gains.
- Sees strong industry tailwinds from electrification, digitalization, and infrastructure spending, but highlights risks such as economic cycles, supply chain constraints, and increasing competition.
- Considers Volvo slightly undervalued at current PE ratios, with expectations for operating margin expansion and a higher long-term valuation if electrification trends accelerate.
Fair Value: SEK 270.00
Overvalued by: 1.3%
Revenue Growth Rate: 8.27%
- Considers Volvo a reliable dividend stock, viewing its current price as slightly above estimated fair value, supported by a strong financial position and modest expected revenue growth.
- Highlights Volvo's appeal for income-focused investors due to sustained dividends, even during periods of global volatility and industry shifts.
- Believes future price appreciation will be gradual as macroeconomic conditions stabilize and revenue grows, with long-term success tied to Volvo’s ability to adapt to EV and sustainability trends.
This article by Simply Wall St is general in nature. We provide commentary based on historical data and analyst forecasts only using an unbiased methodology and our articles are not intended to be financial advice. It does not constitute a recommendation to buy or sell any stock, and does not take account of your objectives, or your financial situation. We aim to bring you long-term focused analysis driven by fundamental data. Note that our analysis may not factor in the latest price-sensitive company announcements or qualitative material. Simply Wall St has no position in any stocks mentioned.
Have feedback on this article? Concerned about the content? Get in touch with us directly. Alternatively, email editorial-team@simplywallst.com