
Is ULVAC Set for Growth After Recent Semiconductor Sector Rally?
If you are puzzling over whether ULVAC's recent moves make it a buy, hold, or sell right now, you are not alone. It is always interesting watching a company with an impressive long-term track record, and even more so when recent stock activity turns heads. Over the past week, ULVAC shares climbed by 1.5%, steadily building on a 4.5% rise for the month. Despite a modest 5.2% gain year-to-date, a look back reveals the stock is still in recovery mode after dropping 10% over the past year. Yet zoom out, and the numbers tell another story, with the stock up an impressive 21.8% over three years and a substantial 87.6% over five years. That kind of growth often prompts investors to wonder if the next wave is coming or if most of the upside is already priced in. Recently, shifting global technology trends have attracted fresh attention to ULVAC as a key player in advanced manufacturing, possibly influencing the uptick in sentiment and share price.
Of course, smart investing means looking beyond just stock price momentum. Based on a six-point valuation checklist, ULVAC is undervalued in three areas, giving it a valuation score of 3. This is a decent start, but not the slam dunk value play that some might hope for. Next, let’s break down each of these classic valuation approaches in context. Stay tuned, because the real secret to getting valuation right is waiting for you at the end of the article.
Why ULVAC is lagging behind its peersApproach 1: ULVAC Discounted Cash Flow (DCF) Analysis
The Discounted Cash Flow (DCF) model estimates a company's true worth by projecting its future free cash flows and then discounting those numbers back to today’s value to account for risk and the time value of money. In ULVAC’s case, the model used is a two-stage Free Cash Flow to Equity approach. This means the analysis incorporates current operations as well as a longer-term outlook to better capture a changing cash flow profile.
ULVAC currently generates free cash flow (FCF) of approximately ¥18,670 million. Analyst projections suggest the company’s annual FCF will grow in the coming years, with the 2028 estimate set at ¥23,100 million. Beyond that, further projections are extrapolated, showing FCF trending between ¥7,273 million and ¥39,818 million for the next decade. These estimates, while partly built on analyst forecasts, also rely on Simply Wall St's extrapolation to fill in the gaps where no direct market guidance exists.
After discounting these projected cash flows to present day, the DCF analysis arrives at an intrinsic value of ¥2,635 per share. Compared to the current share price, this implies the stock is trading at a 144.7% premium to its calculated fair value. In other words, shares appear significantly overvalued based on this model.
Result: OVERVALUED
Head to the Valuation section of our Company Report for more details on how we arrive at this Fair Value for ULVAC.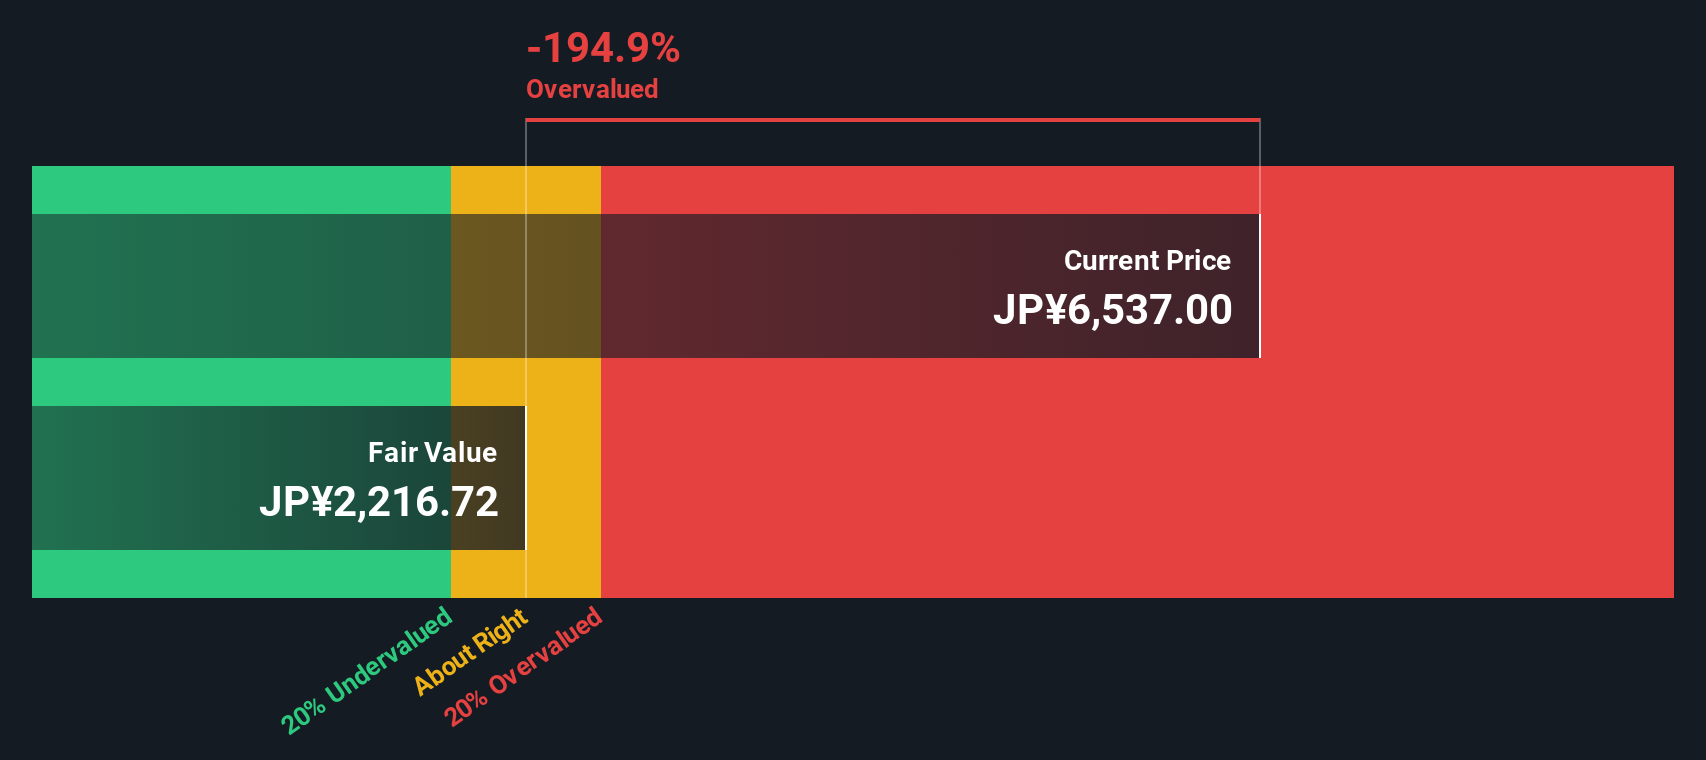
Approach 2: ULVAC Price vs Earnings
The Price-to-Earnings (PE) ratio is widely considered a solid yardstick for valuing profitable companies like ULVAC. It provides a straightforward snapshot of how much investors are willing to pay for each unit of current earnings, which makes it especially useful for comparing companies within the same industry.
Interpreting whether a PE ratio is “normal” or “fair” depends on factors like how quickly a company is expected to grow and the risks it faces compared to peers. Typically, faster-growing businesses or those with lower risk profiles can justify higher PE multiples. On the other hand, slower growth or greater risks tend to push fair multiples lower.
ULVAC currently trades at a PE ratio of 19.0x. This sits above the Semiconductor industry average of 15.4x but below the average of its direct peers at 23.7x. This middle-of-the-pack position suggests the market is pricing in some of ULVAC’s strengths while stopping short of attaching the kind of premium seen in its closest competitors.
Simply Wall St’s proprietary “Fair Ratio” model goes a step further by factoring in not just raw peer or industry averages but also crucial details like ULVAC’s earnings growth outlook, profit margin, market cap, and risk profile. For ULVAC, the Fair Ratio stands at 19.7x. Because this estimate incorporates a broader and more tailored set of company fundamentals, it arguably provides a more accurate sense of fair value than simple peer comparisons.
With ULVAC’s actual PE multiple just shy of the Fair Ratio, the valuation looks fairly balanced by this method. This suggests that the current price reflects its outlook and fundamentals well.
Result: ABOUT RIGHT

Upgrade Your Decision Making: Choose your ULVAC Narrative
Earlier, we mentioned that there is an even better way to understand valuation. Let’s introduce you to Narratives. A Narrative is your personal story behind a company’s numbers, allowing you to connect your own views about ULVAC’s future revenue, earnings, and margins with a customized estimate of fair value. By linking the company’s story to a financial forecast and fair value calculation, Narratives go beyond traditional valuation models and give you a complete picture that reflects your unique outlook.
Narratives are simple to use and accessible on Simply Wall St’s Community page, where millions of investors share perspectives and forecasts. They enable you to easily compare your Fair Value with the current share Price, helping you decide when a stock might be a buy or sell for you. Plus, when new information like earnings or industry news emerges, Narratives update automatically to ensure your investment thesis stays relevant and accurate.
For example, one ULVAC Narrative might reflect an optimistic outlook with a high fair value, while another, more conservative investor’s Narrative could point to a lower figure, all based on different assumptions and expectations about the company’s future.
Do you think there's more to the story for ULVAC? Create your own Narrative to let the Community know!
This article by Simply Wall St is general in nature. We provide commentary based on historical data and analyst forecasts only using an unbiased methodology and our articles are not intended to be financial advice. It does not constitute a recommendation to buy or sell any stock, and does not take account of your objectives, or your financial situation. We aim to bring you long-term focused analysis driven by fundamental data. Note that our analysis may not factor in the latest price-sensitive company announcements or qualitative material. Simply Wall St has no position in any stocks mentioned.
Have feedback on this article? Concerned about the content? Get in touch with us directly. Alternatively, email editorial-team@simplywallst.com