
Evaluating the Valuation of MITSUI E&S (TSE:7003) After Its Remarkable Share Rally
Price-to-Earnings of 24.5x: Is it justified?
Based on the price-to-earnings ratio, MITSUI E&S currently trades at 24.5 times earnings, a notable premium to the industry average. This suggests the market has bid up the shares significantly above what is typical for peers in the Japanese machinery sector.
The price-to-earnings ratio is a widely used valuation measure that compares a company’s current share price to its per-share earnings. For capital goods and machinery businesses, it reflects how much investors are willing to pay for every unit of current profitability. This often indicates either optimism for future growth or confidence in company stability.
For MITSUI E&S, the elevated multiple signals that the market may be pricing in growth or future profitability improvements that outpace the sector, despite the company’s recent profit margin contraction. However, it raises the question of whether current fundamentals support such optimism or if expectations may be running ahead of reality.
Result: Fair Value of ¥2,938.29 (OVERVALUED)
See our latest analysis for MITSUI E&S.However, slower revenue growth or a significant price drop could quickly shift sentiment and challenge the optimism that is currently driving MITSUI E&S’s valuation.
Find out about the key risks to this MITSUI E&S narrative.Another View: What Does Our DCF Model Say?
Taking a step back from industry comparisons, our DCF model examines MITSUI E&S through a long-term cash flow perspective. This approach also suggests the stock is overvalued at current levels, which repeats earlier concerns. Could both methods be signaling investors to be cautious, or is something being overlooked in these assumptions?
Look into how the SWS DCF model arrives at its fair value.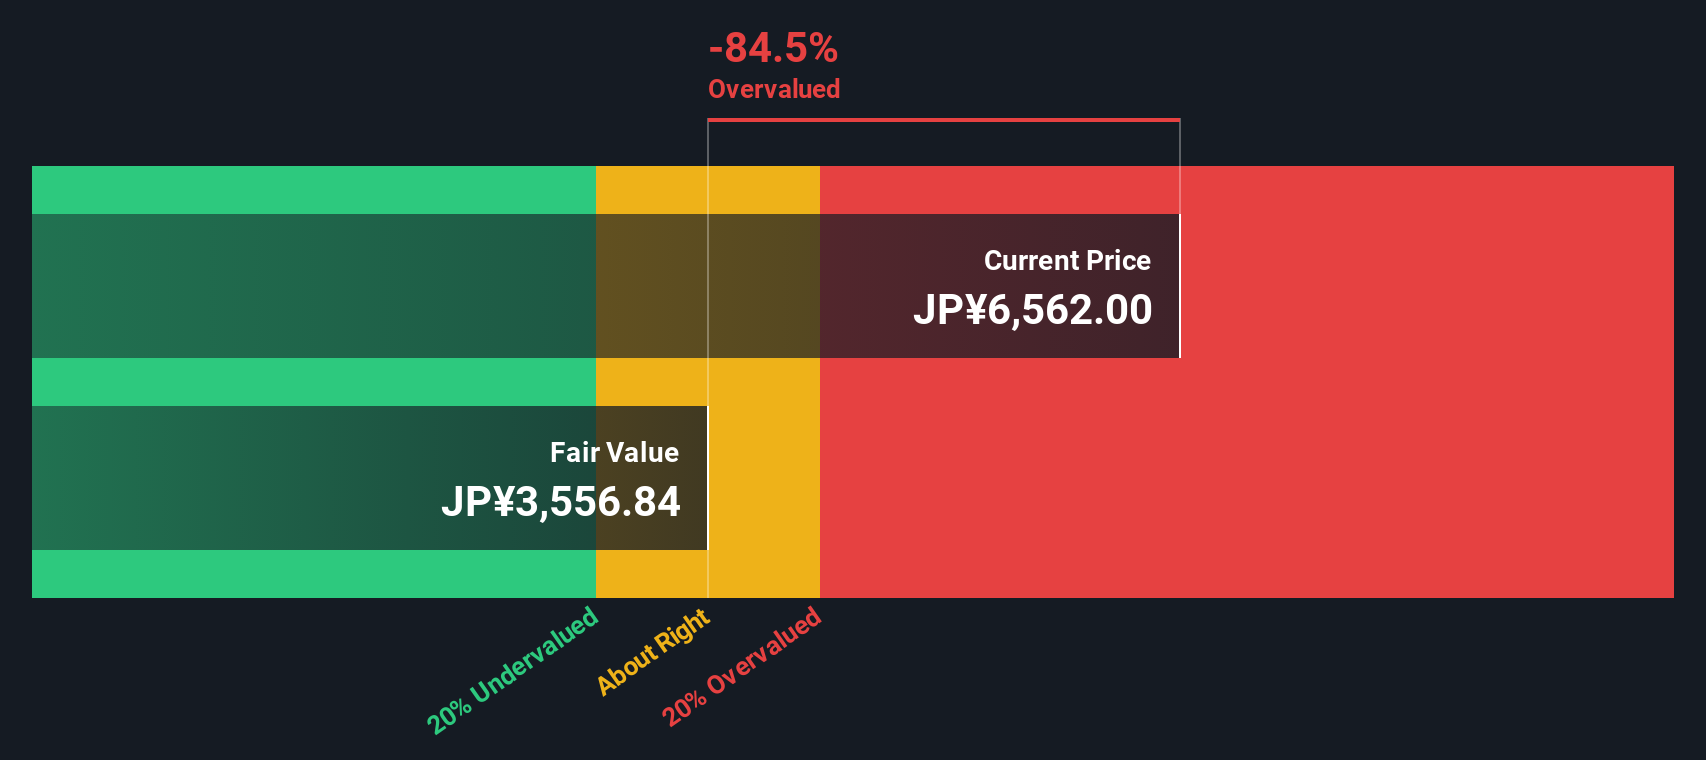
Build Your Own MITSUI E&S Narrative
If you see the story differently or want to dig deeper into the numbers yourself, you can shape your own analysis in just a few minutes. Do it your way
A great starting point for your MITSUI E&S research is our analysis highlighting 1 key reward and 3 important warning signs that could impact your investment decision.
Looking for more investment ideas?
Take your research a step further and unlock new opportunities. There are quality investments waiting for you that match your style and goals. Don’t let a great stock pass you by.
- Uncover companies with robust balance sheets and untapped potential by checking out undervalued stocks based on cash flows, built for forward-thinking investors.
- Tap into futuristic growth trends by investigating AI penny stocks, reshaping industries with smarter automation and innovation.
- Boost your portfolio’s passive income with dividend stocks with yields > 3%, which consistently deliver attractive yields above 3%.
This article by Simply Wall St is general in nature. We provide commentary based on historical data and analyst forecasts only using an unbiased methodology and our articles are not intended to be financial advice. It does not constitute a recommendation to buy or sell any stock, and does not take account of your objectives, or your financial situation. We aim to bring you long-term focused analysis driven by fundamental data. Note that our analysis may not factor in the latest price-sensitive company announcements or qualitative material. Simply Wall St has no position in any stocks mentioned.
Have feedback on this article? Concerned about the content? Get in touch with us directly. Alternatively, email editorial-team@simplywallst.com