
- PREMIUM
- LIVE QUOTES
- INSTITUTIONS
 Index Options
 State Street
 CME Group
 Nasdaq
 Cboe
Cboe TradingView
 Wall Street Journal
Can BP’s Share Price Momentum Continue as Elliott Pressures for a Turnaround?
If you have been watching BP shares and wondering whether now is the time to make a move, you are not alone. The stock has been dancing around headlines and speculation, putting investors firmly in “wait and see” mode. Over the past quarter, BP’s share price rose an impressive 17.8% and is still up 4.6% so far this year. That momentum comes despite some recent volatility from takeover rumors. Reports suggested Shell was eyeing BP, but those whispers eventually faded after denials and mixed signals from both companies.
At the same time, activist investor Elliott Management has increased the pressure on BP’s incoming chairman, urging more decisive action on costs and strategy. This kind of shareholder activism can rattle nerves in the short term, but it often hints at change ahead and sometimes unlocks fresh value for investors willing to handle some volatility.
So is the market missing something big here? BP currently trades at a 53.9% discount to its estimated intrinsic value and just under 5% below the average analyst price target. Using six key valuation checks, BP scored a strong 5 out of 6, suggesting the stock appears undervalued in nearly every standard way it is measured.
But what does that actually mean for long-term investors? Next, we will break down each valuation approach in plain English, weighing up the pros and cons. Stay tuned until the end, because there is another perspective on valuation that could provide an advantage over the crowd.
BP delivered 4.5% returns over the last year. See how this stacks up to the rest of the Oil and Gas industry.Approach 1: BP Cash Flows
The Discounted Cash Flow (DCF) model is a popular way to estimate a company’s intrinsic worth. It accomplishes this by projecting future cash flows that the business is expected to generate and then discounting them back to their value in today’s money.
For BP, the most recent Free Cash Flow stands at $10.3 billion, with analysts anticipating steady growth over the next decade. Projections show BP could be producing about $13.3 billion in annual free cash flow by 2035, based on current estimates. All these future cash flows are calculated using a two-stage DCF method, which seeks to capture both near-term growth and a longer-term, steady-state outlook.
When all these discounted projections are added together, BP’s estimated intrinsic value comes to £9.10 per share. When this figure is compared to BP’s current share price, the DCF approach indicates the stock is trading at a 53.9% discount to its estimated value. In other words, the market appears to be overlooking much of BP’s potential future earning power.
Result: UNDERVALUED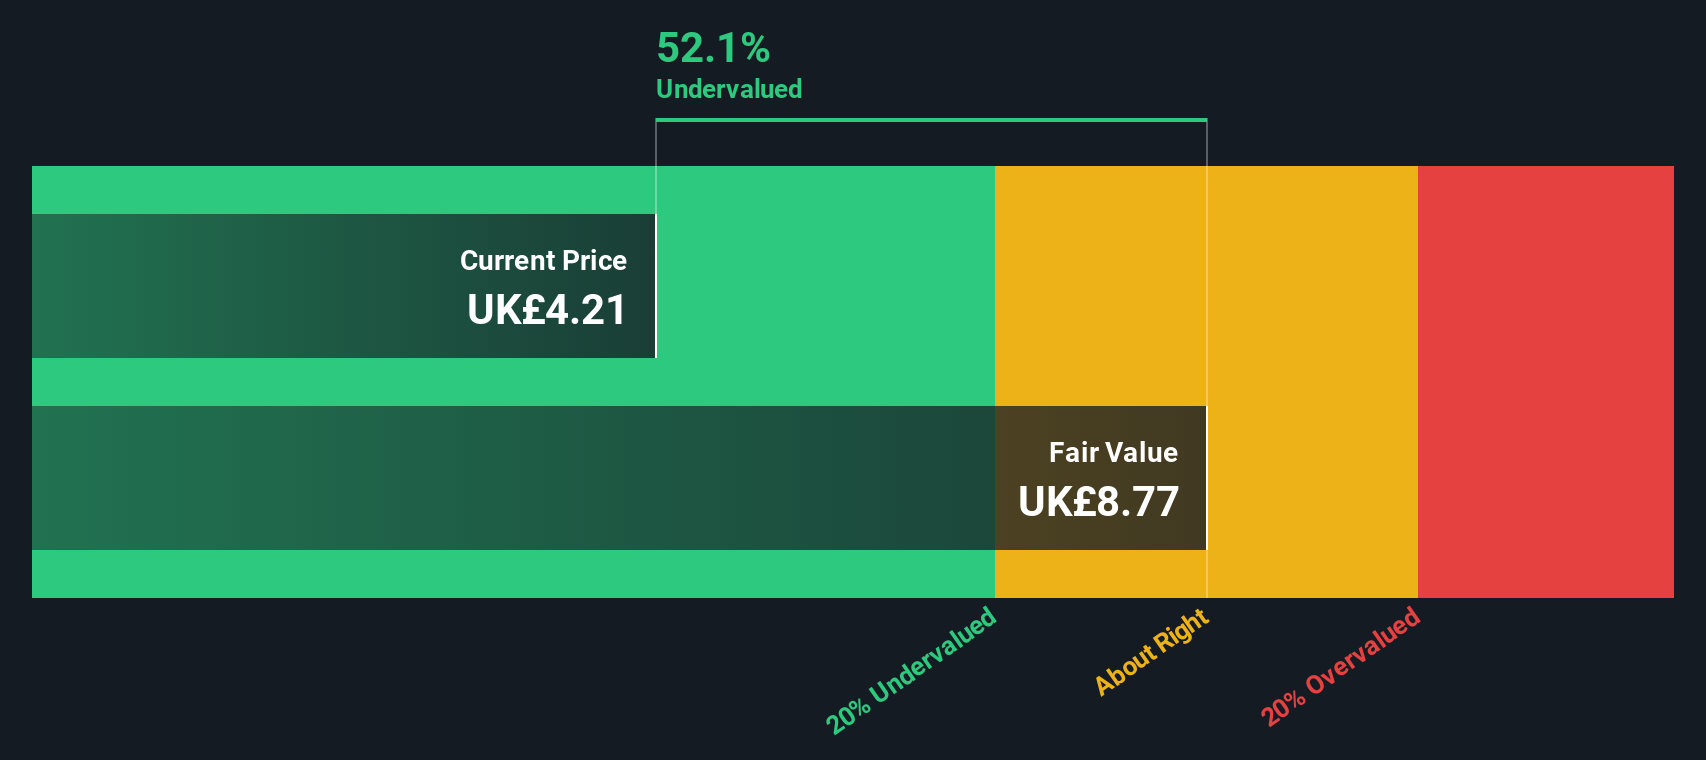
Approach 2: BP Price vs Sales
The price-to-sales (P/S) ratio is a widely used measure to value profitable companies, especially in sectors where earnings can be affected by temporary swings in commodity prices or non-cash items. By comparing a company's market capitalization to its total revenues, the P/S ratio offers a straightforward way to check how much investors are willing to pay for each pound of BP’s sales.
It is important to remember that growth prospects and company-specific risks play a big role in determining what a “normal” or “fair” multiple should look like. Higher potential growth or lower risk often justify a higher ratio, while slower-growing or more volatile businesses typically trade lower relative to their sales.
Currently, BP is trading on a P/S ratio of 0.47x, which is noticeably below both the Oil and Gas industry average of 1.70x and the average for direct peers at 0.58x. Simply Wall St’s proprietary Fair Ratio, which blends BP’s earnings outlook, margins, and industry dynamics, is calculated at 1.12x. With BP’s actual multiple well below this fair benchmark, it suggests the market is currently discounting BP’s revenue potential more than necessary.
Result: UNDERVALUED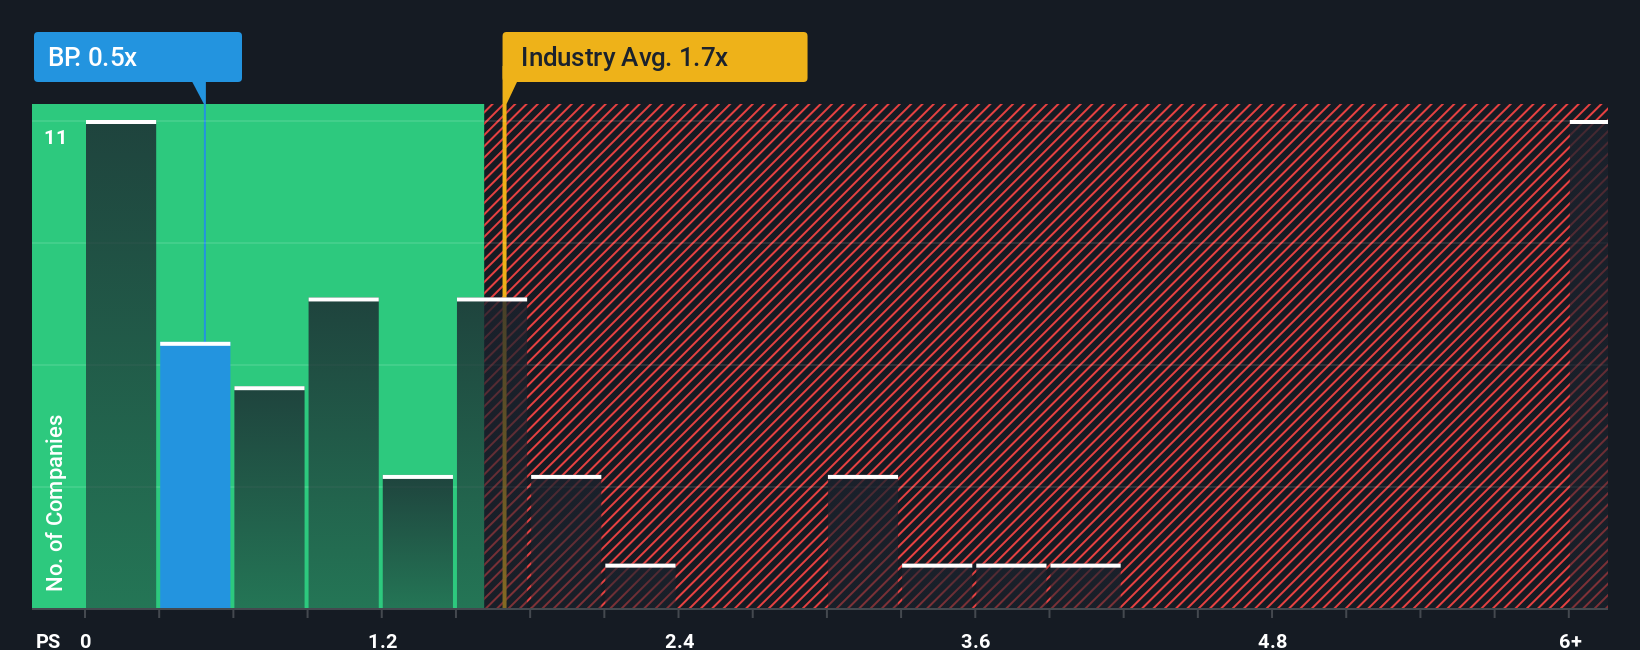
Upgrade Your Decision Making: Choose your BP Narrative
Most investors focus only on the latest numbers, but a Narrative puts you in control by letting you craft your own story about BP’s future and then see how your views affect what the shares are really worth.
Think of a Narrative as your personalized investment viewpoint. You select what you believe about BP’s revenue, earnings, and margins, create a financial forecast based on those beliefs, and then link it to a fair value supported by the data.
With Simply Wall St, building and sharing a Narrative is simple. You can compare your perspective to those of millions of investors in the community, making this once-complex process both accessible and actionable for everyone.
Narratives dynamically adapt to new information such as quarterly earnings or major news events, keeping your estimates and actionable signals up to date. This helps you decide when BP’s price offers an attractive opportunity relative to your fair value.
For example, one investor might believe BP can reach a fair value of £5.18 based on aggressive earnings growth and margin improvement, while another sees £3.47 as appropriate due to industry risks. Your Narrative becomes the smartest way to anchor decisions to your own logic, not just headlines.
Do you think there's more to the story for BP? Create your own Narrative to let the Community know!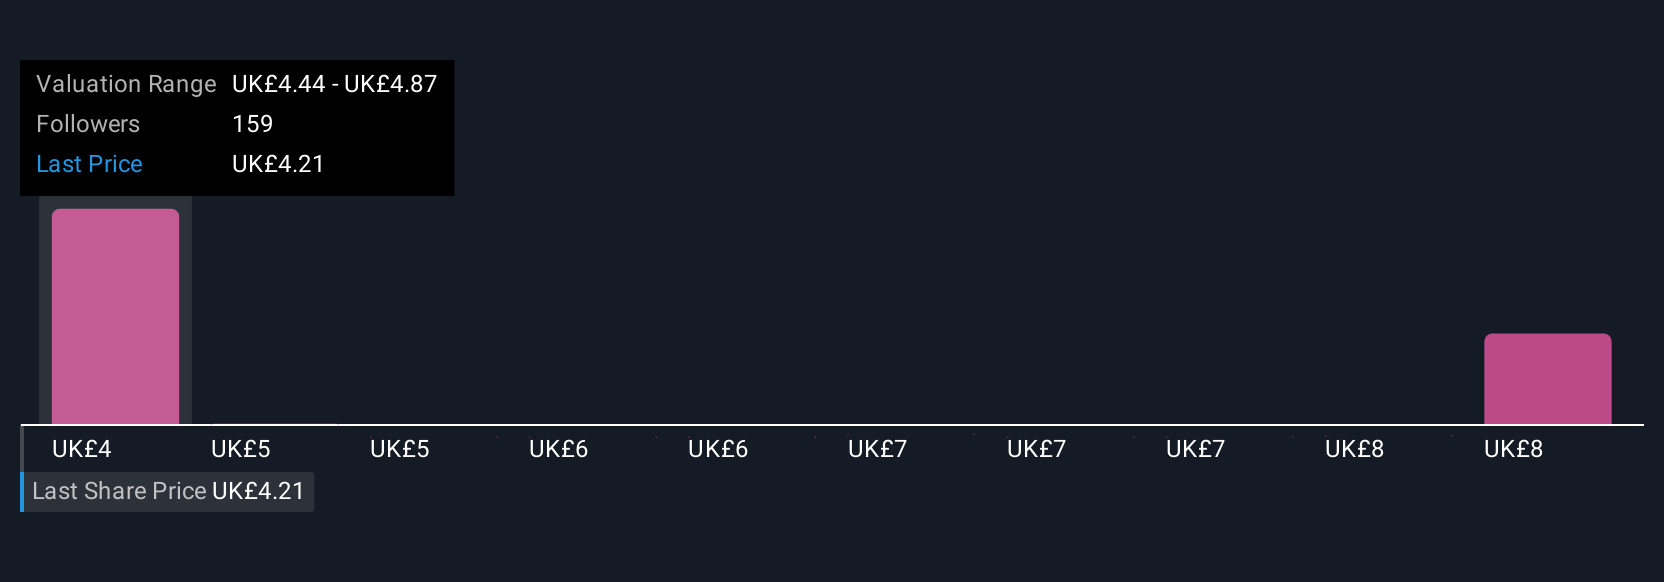
This article by Simply Wall St is general in nature. We provide commentary based on historical data and analyst forecasts only using an unbiased methodology and our articles are not intended to be financial advice. It does not constitute a recommendation to buy or sell any stock, and does not take account of your objectives, or your financial situation. We aim to bring you long-term focused analysis driven by fundamental data. Note that our analysis may not factor in the latest price-sensitive company announcements or qualitative material. Simply Wall St has no position in any stocks mentioned.
Have feedback on this article? Concerned about the content? Get in touch with us directly. Alternatively, email editorial-team@simplywallst.com