
Where Does Church & Dwight Stand After This Year’s 9% Slide?
If you are sizing up what to do with Church & Dwight stock right now, you are not alone. Lots of investors are watching this household products name after a stretch of mixed performance. Over the past year, shares have slipped about 6.4%, and the year-to-date number is down approximately 9.4%. While these recent declines may seem discouraging at first glance, it is important to remember that Church & Dwight’s long-term track record still shows underlying resilience, with three-year total returns of 12.5%.
The market seems to be rethinking the company’s growth prospects and risk profile, especially as Church & Dwight has delivered above-average annual revenue and profit growth lately. Despite a modest drop over 90 days, analysts’ targets are currently about 6% above where the stock trades now. This hints at the possibility that the market might be underestimating some of CHD’s strengths or simply demanding a cheaper entry after a period of elevated valuations. In fact, if you dig into traditional valuation methods, Church & Dwight earns a value score of 2 out of 6, suggesting it is undervalued in two important categories but not exactly a bargain across the board.
So, what can investors take away from this mix of recent weakness and steady long-term growth? Let us break down the most common valuation approaches. In addition, at the end of the article, we will share a powerful way to get an even clearer picture of what this stock is really worth.
Church & Dwight delivered -6.4% returns over the last year. See how this stacks up to the rest of the Household Products industry.Approach 1: Church & Dwight Cash Flows
A Discounted Cash Flow (DCF) model estimates what a stock is really worth by projecting the company’s future free cash flows and then discounting those numbers back to today’s value. This gives investors a sense of a company’s intrinsic value, independent of short-term market noise.
For Church & Dwight, the most recent free cash flow stands at $873 million. Analysts expect this to grow steadily each year, reaching around $1.45 billion by 2035. Looking specifically at 2029, forecasts place free cash flow near $1.2 billion, reflecting consistent annual growth.
Putting these projections together, the DCF calculation estimates Church & Dwight’s fair value at approximately $121.84 per share. Based on where shares are trading right now, the stock appears to be 22.8% undervalued. This points to a notable gap between today’s price and the value that future cash flow generation could support.
Result: UNDERVALUED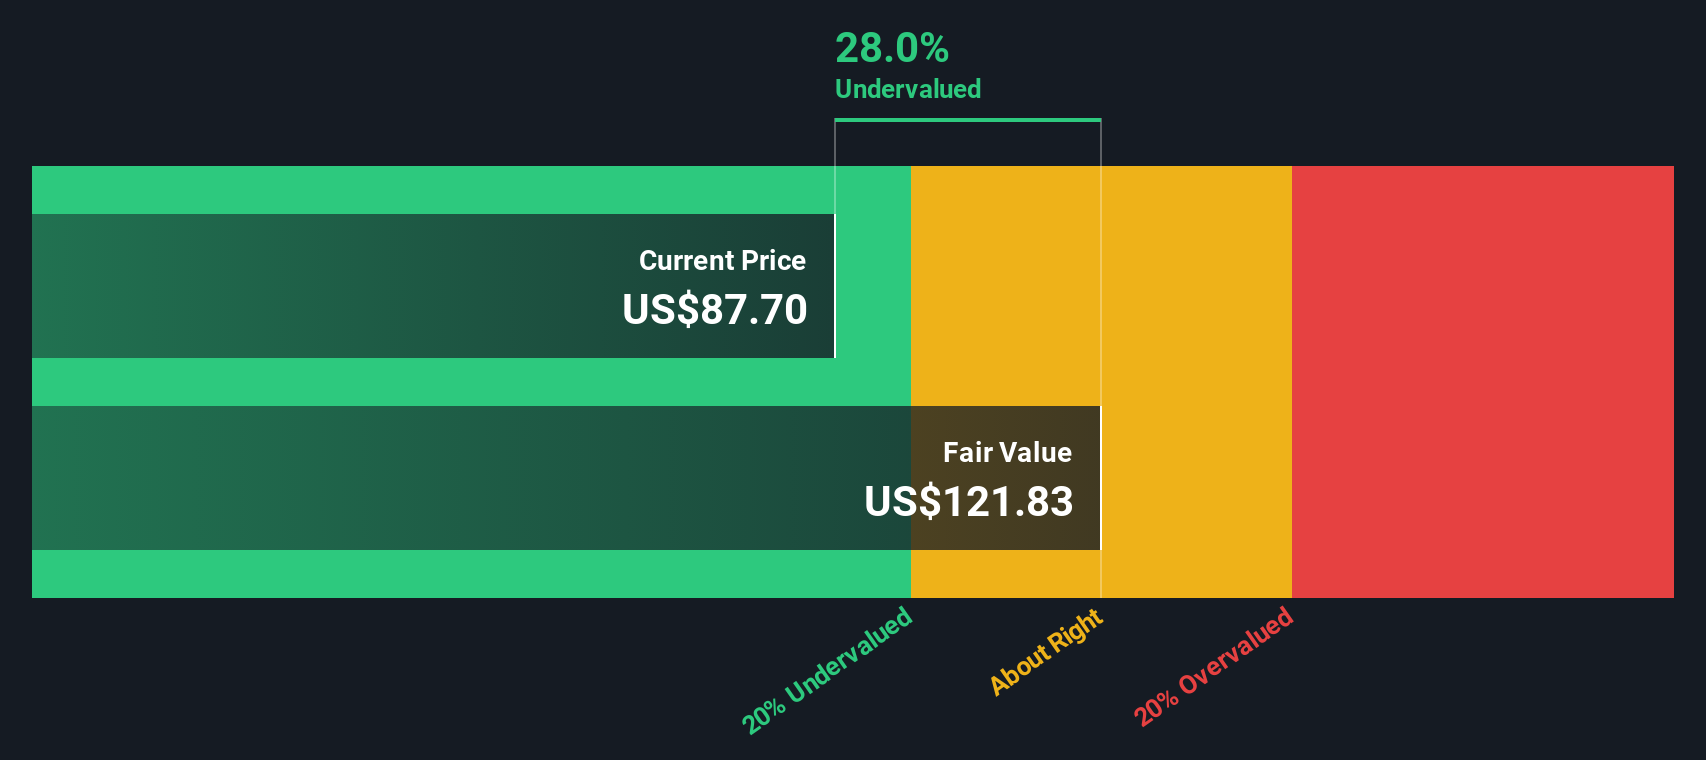
Approach 2: Church & Dwight Price vs Earnings
For companies like Church & Dwight that are consistently profitable, the Price-to-Earnings (PE) ratio is often the go-to yardstick for valuation. This multiple shows how much investors are willing to pay for each dollar of earnings. It serves as a quick gauge of whether a stock looks expensive or inexpensive relative to its profits.
Growth expectations and risk both play a significant role in shaping what is considered a “normal” or “fair” PE. Fast-growing, reliable companies often trade at higher multiples, reflecting confidence in future profit expansion. In contrast, more mature or volatile businesses typically command lower PE ratios due to slower growth or added uncertainty.
Currently, Church & Dwight trades at a PE of 43.6x, which is significantly above the household products industry average of 18.1x and the peer average of 18.9x. Using a proprietary Fair Ratio that incorporates growth prospects, profitability, industry dynamics, and risk, Simply Wall St estimates a fair multiple for Church & Dwight at 28.3x. Because the current PE is much higher than this fair benchmark, it suggests the stock price is elevated compared to what its fundamentals justify.
Result: OVERVALUED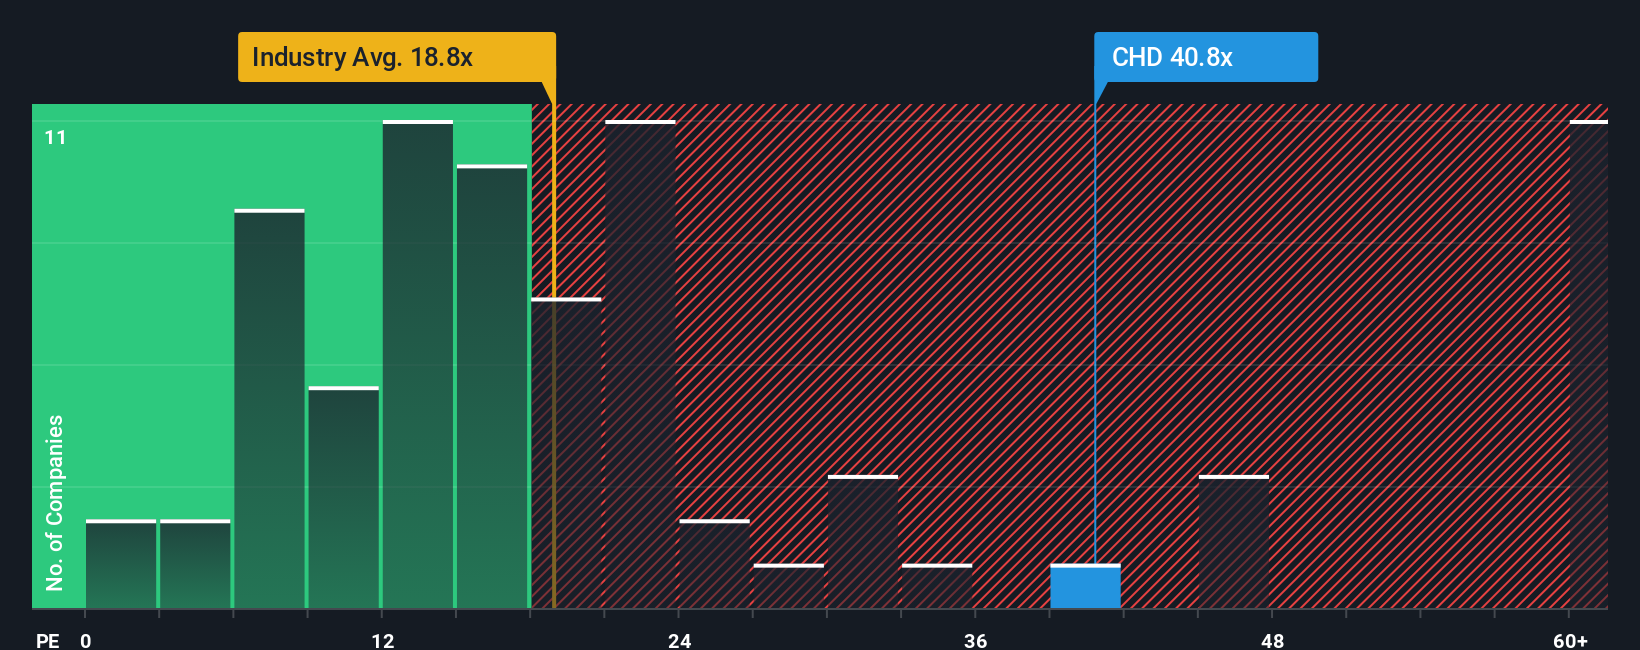
Upgrade Your Decision Making: Choose your Church & Dwight Narrative
A Narrative is simply your story about a company that weaves together the numbers, such as fair value, future revenue, and margin assumptions, with your own perspective on where the business is headed and why. By linking this story to a financial forecast and then translating it to a fair value, Narratives give you a concrete way to back up your view and guide your decision to buy or sell by comparing what you believe Church & Dwight is truly worth to its current market price.
On Simply Wall St, Narratives are easy to create, update, and compare within a community of millions of investors, giving you a dynamic and flexible tool that evolves as news breaks or new earnings come in. For example, some investors reviewing Church & Dwight may see rapid e-commerce growth and global wellness trends and calculate a bullish price target as high as $120 per share. Others, concerned about margin pressures and sluggish vitamin sales, might set a fair value closer to $73. Narratives empower you to factor in your own evidence and outlook, so your decisions reflect your unique understanding, not just consensus views.
Do you think there's more to the story for Church & Dwight? Create your own Narrative to let the Community know!
This article by Simply Wall St is general in nature. We provide commentary based on historical data and analyst forecasts only using an unbiased methodology and our articles are not intended to be financial advice. It does not constitute a recommendation to buy or sell any stock, and does not take account of your objectives, or your financial situation. We aim to bring you long-term focused analysis driven by fundamental data. Note that our analysis may not factor in the latest price-sensitive company announcements or qualitative material. Simply Wall St has no position in any stocks mentioned.
Have feedback on this article? Concerned about the content? Get in touch with us directly. Alternatively, email editorial-team@simplywallst.com