
Is There Still an Opportunity in TSM Stock After Its 21% Jump This Quarter?
If you are watching Taiwan Semiconductor Manufacturing stock right now, you are not alone. Whether you already own shares or you are simply deciding if now is the time to get in, the company's recent run has likely caught your attention. Over the past year, TSM has delivered an impressive total return of nearly 37%, leaving plenty of investors wondering if the momentum can last or if they are arriving late to the party.
The past three months alone have seen the stock gain more than 21%, bouncing back strongly from previous dips. Even more striking, investors looking back over the last five years are sitting on gains of over 200%. This longevity in performance suggests there is more to the story than just short-term hype. While the stock did slide by about 3% in June, longer-term trends point to sustained growth and renewed optimism around demand for advanced semiconductors, an area where TSM remains the dominant player.
Of course, everyone wants to know whether the stock is overvalued after such a rally. That is where things get interesting: when we run TSM through six classic valuation checks, it scores a 4 out of 6. That is a sign the company is still undervalued by several important metrics, even with recent price gains and its current discount to analyst targets.
Up next, we will break down those six valuation methods and see exactly where TSM shines or lags. After that, stay tuned because there is an even smarter way to think about valuation that could give you the real edge in deciding what to do next.
Taiwan Semiconductor Manufacturing delivered 36.8% returns over the last year. See how this stacks up to the rest of the Semiconductor industry.Approach 1: Taiwan Semiconductor Manufacturing Cash Flows
The Discounted Cash Flow (DCF) model estimates a company's value by projecting its future cash flows and then discounting those amounts back to today's dollars. This approach helps investors judge what a business is really worth, regardless of daily stock price movements.
For Taiwan Semiconductor Manufacturing, the latest twelve months' free cash flow stands at over $803 billion. Analysts expect this figure to grow sharply, reaching more than $4 trillion by 2035. According to recent projections, the company's cash flow is expected to rise significantly each year, with estimates for 2027 already topping $1.78 trillion. Over the next decade, these robust forecasts reflect strong market demand for advanced chips and TSM's ability to lead the sector.
By discounting all these projected cash flows to their present value, the DCF calculation arrives at an intrinsic value of $260.58 per share. This figure is about 10.7% higher than the current trading price, suggesting Taiwan Semiconductor Manufacturing stock is 10.7% undervalued by this method.
Result: UNDERVALUED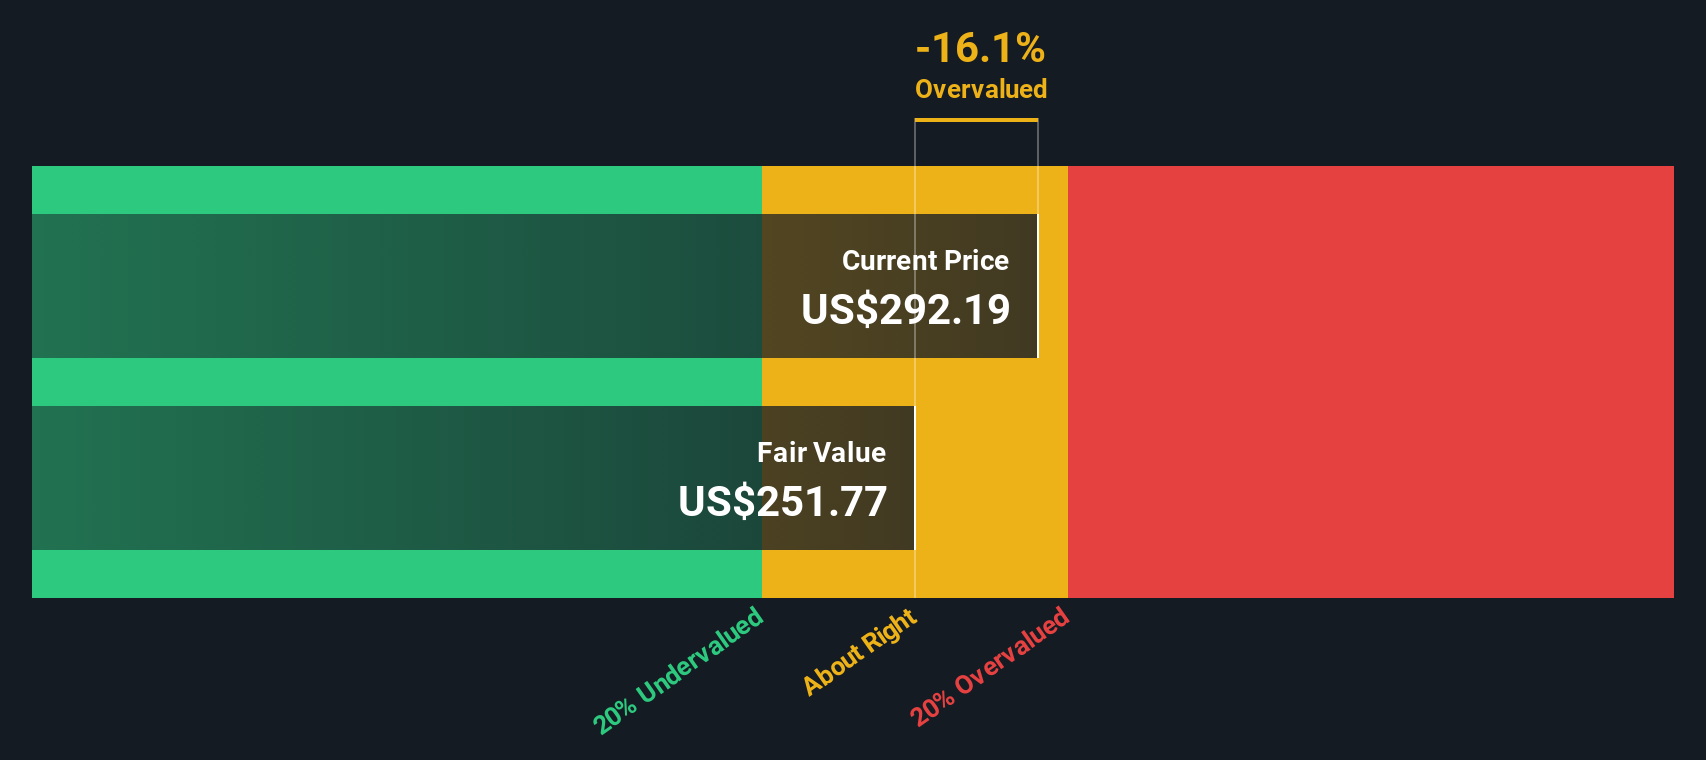
Approach 2: Taiwan Semiconductor Manufacturing Price vs Earnings
The Price-to-Earnings (PE) ratio is one of the most widely used metrics for valuing profitable companies like Taiwan Semiconductor Manufacturing. The PE ratio offers a quick snapshot of how much investors are paying for a dollar of current earnings, allowing for easy comparison across similar businesses. For mature, growing companies in established sectors, the PE ratio is especially meaningful as it captures both the current profitability and the market's confidence in future prospects.
Not all PE ratios are created equal. A "normal" or "fair" PE ratio depends heavily on a company’s future earnings growth and its risks. High-growth firms or those perceived as less risky typically justify higher PE ratios, while slower growth or higher uncertainty can compress these multiples.
Currently, Taiwan Semiconductor Manufacturing trades on a PE ratio of 21.27x. This is notably below the semiconductor industry average of 28.47x and even further from the peer group average of 60.06x. According to Simply Wall St’s proprietary analysis, the Fair Ratio for TSM, calculated with its earnings quality, growth outlook, profitability, and sector trends in mind, lands at 37.39x. Because TSM’s actual PE is significantly lower than its Fair Ratio, this indicates that the company is undervalued on this basis, with the market not fully recognizing its earnings power and future potential.
Result: UNDERVALUED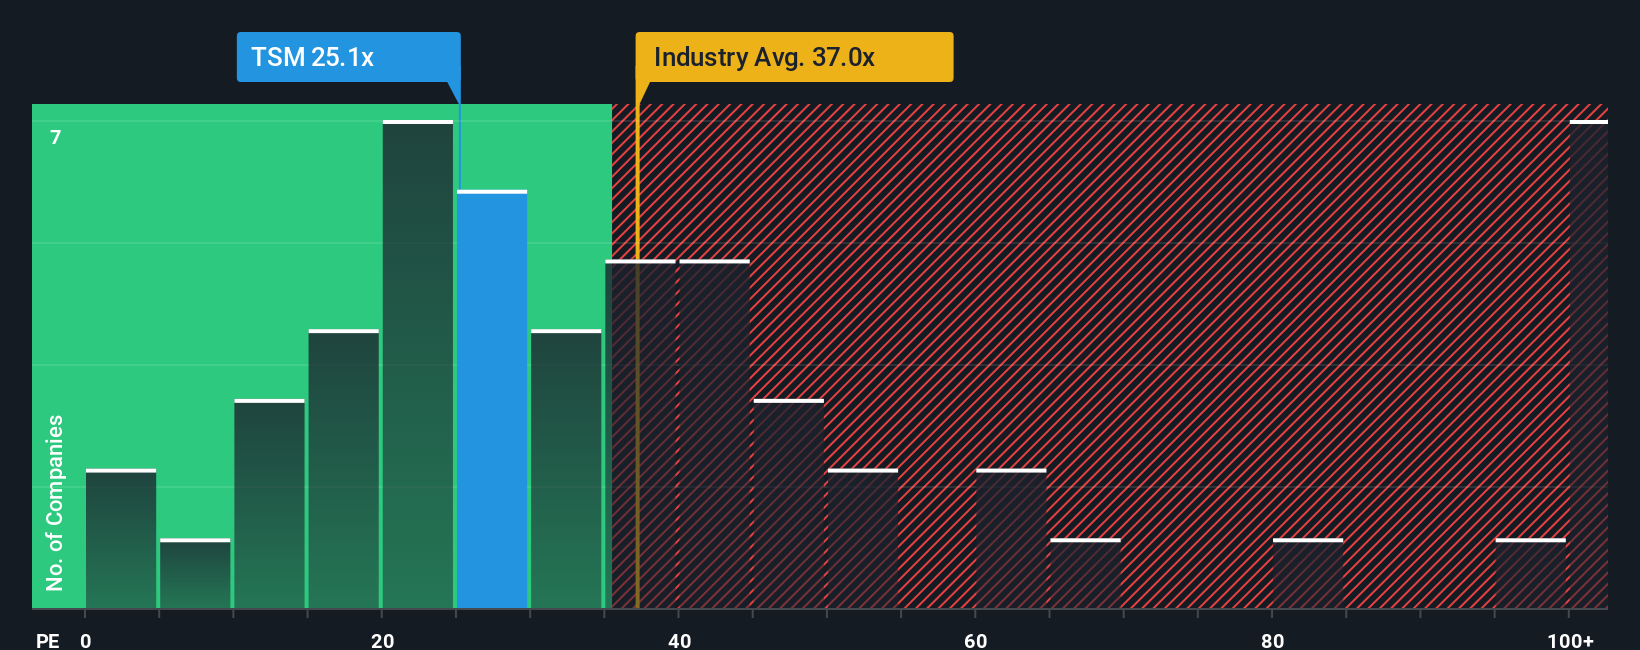
Upgrade Your Decision Making: Choose your Taiwan Semiconductor Manufacturing Narrative
Now, let us introduce a smarter, more dynamic way to guide your investment decisions: Narratives. A Narrative is simply your story or perspective about a company’s future. It connects what you believe about Taiwan Semiconductor Manufacturing’s prospects with your financial estimates, such as revenue growth, margins, and fair value.
With Narratives, you move beyond just numbers and ratios. Instead, you tie the company’s big-picture story, for example, its innovation pipeline, customer strength, or exposure to key markets, directly to a forecast and a resulting fair value. This makes Narratives a practical, accessible tool used by millions of investors on the Simply Wall St platform, providing a clear framework to decide when a stock may be undervalued or overvalued by directly comparing your fair value against the current price.
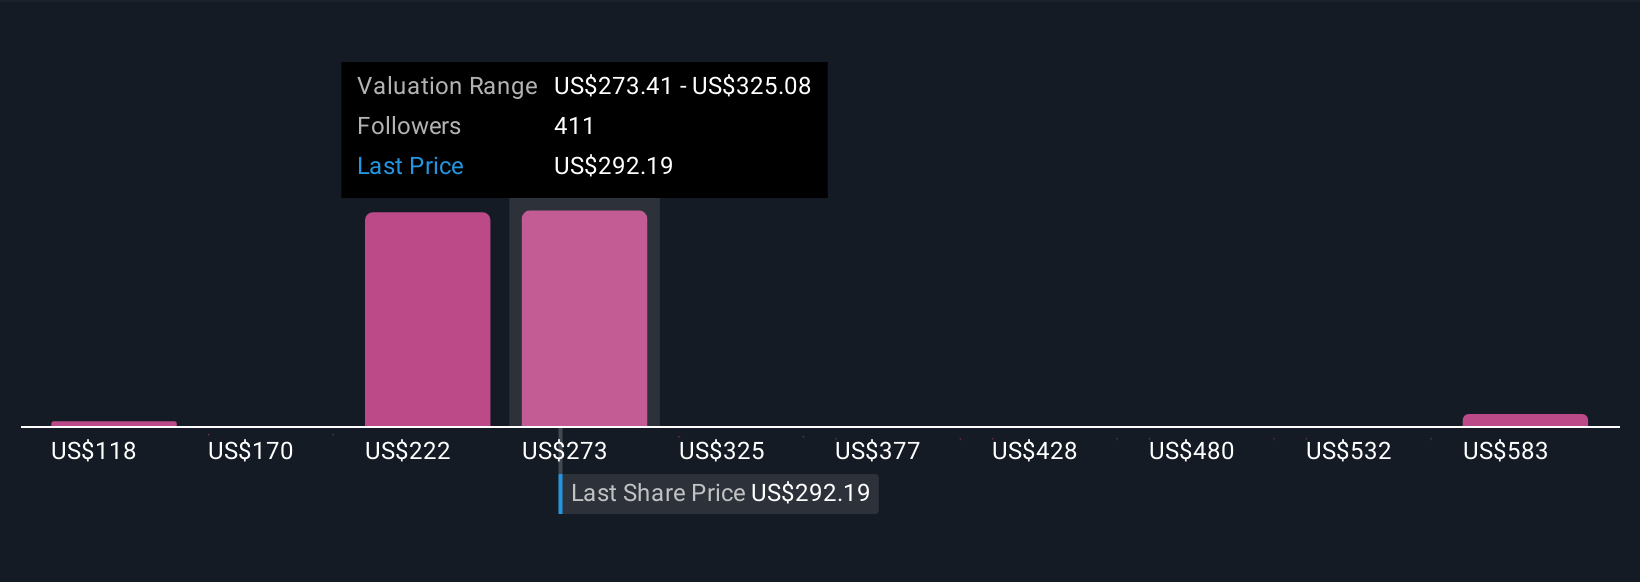
Additionally, Narratives update automatically as news arrives or new earnings are released, keeping your analysis fresh with the latest information. For instance, some investors see TSM worth $118 per share by assuming steady geopolitical conditions and industry growth, while others forecast as high as $630 by projecting strong AI and advanced chip demand. These represent two different stories with two different fair values, both easy to compare and discuss in the Simply Wall St community.
Here is your revised article with em dashes removed and the formatting improved:For Taiwan Semiconductor Manufacturing, we'll make it easy for you with previews of two leading Taiwan Semiconductor Manufacturing narratives:
🐂 Taiwan Semiconductor Manufacturing Bull Case
- Fair value: $629.70
- TSM currently trades at 63% below this narrative’s fair value.
- Revenue growth rate: 26%.
- TSMC stands to benefit from persistent demand for advanced semiconductors, driven by AI, IoT, and 5G technologies. This is expected to fuel strong and diversified revenue growth.
- Healthy profit margins are expected to be maintained as a result of ongoing innovation, strategic capital expenditure, and a robust industry position.
- Main risks include the long-term sustainability of AI chip demand, geopolitical tensions in the region, and challenges faced by key customers, such as Apple's market share in China.
🐻 Taiwan Semiconductor Manufacturing Bear Case
- Fair value: $118.40
- TSM currently trades at 97% above this narrative’s fair value.
- Revenue growth rate: -23.21%.
- This scenario assumes a stable geopolitical environment, a healthy balance sheet, and double-digit industry growth, but forecasts slower overall revenue expansion.
- Key risks include potential disruption arising from a China-Taiwan conflict and TSMC’s significant reliance on a small number of large customers and specialized suppliers.
- Even with constructive assumptions, this narrative values TSM well below its current price, raising questions about the stock’s upside and sustainability at present levels.
This article by Simply Wall St is general in nature. We provide commentary based on historical data and analyst forecasts only using an unbiased methodology and our articles are not intended to be financial advice. It does not constitute a recommendation to buy or sell any stock, and does not take account of your objectives, or your financial situation. We aim to bring you long-term focused analysis driven by fundamental data. Note that our analysis may not factor in the latest price-sensitive company announcements or qualitative material. Simply Wall St has no position in any stocks mentioned.
Have feedback on this article? Concerned about the content? Get in touch with us directly. Alternatively, email editorial-team@simplywallst.com