
- PREMIUM
- LIVE QUOTES
- INSTITUTIONS
 Index Options
 State Street
 CME Group
 Nasdaq
 Cboe
Cboe TradingView
 Wall Street Journal
Is Barrick Gold’s 45% Rally Supported by Strong Cash Flow Outlook in 2025?
Approach 1: Barrick Mining Cash Flows
A Discounted Cash Flow (DCF) model estimates a company's intrinsic value by projecting its future free cash flows and discounting them back to today’s dollars. This approach helps investors determine whether a stock's current price reflects its real worth based on expected performance.
Barrick Mining currently generates CA$1.43 billion in Free Cash Flow, with analysts forecasting this figure to trend upward over the coming years. By 2029, Free Cash Flow is projected to reach CA$2.14 billion, highlighting solid growth expectations for the business. The DCF method takes these projections, applies a discount to reflect risk and the time value of money, and concludes that Barrick’s fair intrinsic value is CA$38.13 per share.
When comparing this intrinsic value to Barrick’s present share price, the model suggests the stock is 12.8% undervalued. This indicates some headroom for investors seeking value, though the margin is not extreme.
Result: UNDERVALUED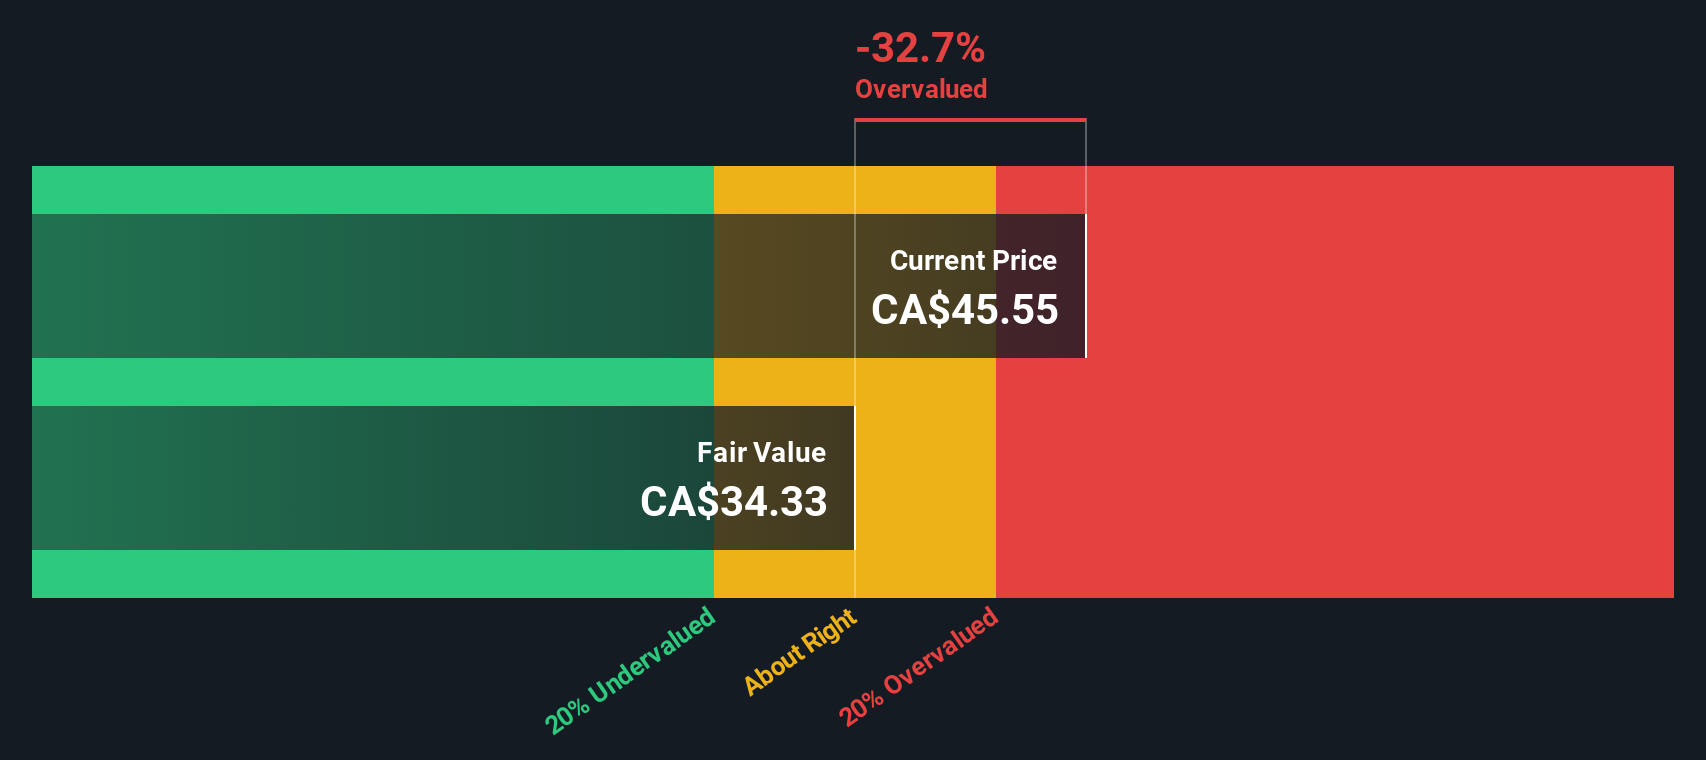
Approach 2: Barrick Mining Price vs Earnings
The Price-to-Earnings (PE) ratio is a favorite valuation tool for profitable companies because it connects a company's share price directly to its earnings power. When evaluating a stable, earnings-generating business like Barrick, the PE ratio helps investors see if the market is asking a reasonable price based on those earnings.
The “right” PE ratio for a stock can vary depending on a company’s growth outlook and the risks it faces. Companies expected to grow quickly, or with more predictable profits, tend to justify higher PE ratios. Conversely, slower growers or those with higher risks typically have lower ratios.
Currently, Barrick trades at a PE ratio of 14.8x. This is just below both the Metals and Mining industry average of 15.6x and significantly lower than the average of its closest peers at 32.8x. In addition, Simply Wall St’s proprietary Fair Ratio, which factors in elements such as Barrick's profit margins, market cap, and risk profile, is 22.5x.
With Barrick’s PE ratio sitting well below the Fair Ratio, the data suggests the stock is undervalued on this measure. This indicates investors may be getting a bargain relative to the company's expected potential and industry peers.
Result: UNDERVALUED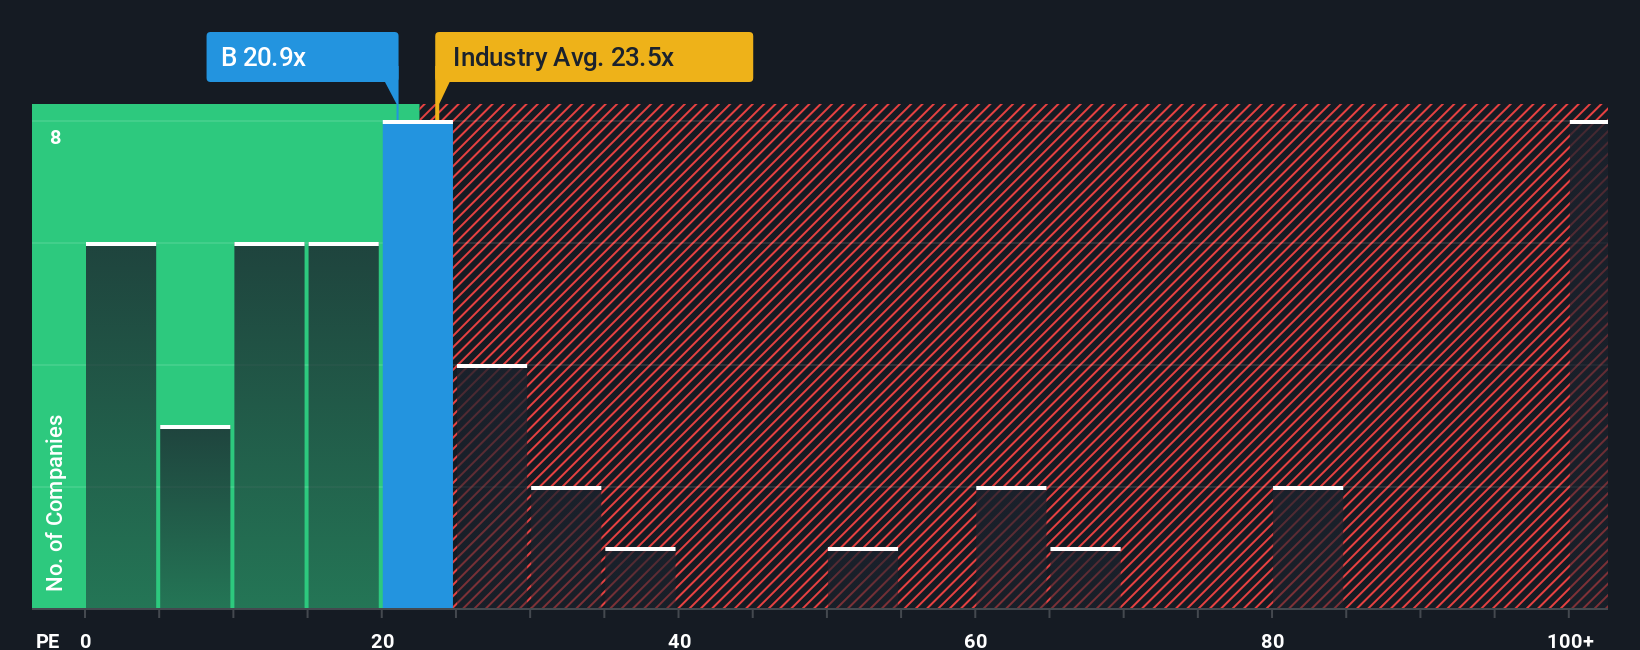
Upgrade Your Decision Making: Choose your Barrick Mining Narrative
Narratives bring investing to life by letting you craft and follow a story behind the numbers, combining your own expectations (like future revenue, earnings, and margins) to arrive at a personal estimate of Barrick Mining’s fair value.
Unlike static ratios or analyst targets, Narratives link Barrick’s unique business drivers such as production growth, margin improvements, and industry risks to a custom financial forecast. This directly connects your perspective or “story” to a live, up-to-date fair value.
On Simply Wall St, millions of investors use Narratives because they make sophisticated valuation tools simple and accessible. This approach lets anyone set their assumptions, compare them to the current share price, and instantly gauge whether it’s time to buy, sell, or hold.
Narratives aren’t set in stone; they update automatically as new information emerges. Whether it’s fresh earnings reports, project updates, or breaking news, this ensures your investment view stays relevant and informed.
For example, with Barrick Mining, some investors see expansion in gold and copper capacity driving future demand and target a fair value as high as CA$50.89. Others, more cautious about risks like political instability and resource constraints, believe the fair value could be closer to CA$30.86.
Do you think there's more to the story for Barrick Mining? Create your own Narrative to let the Community know!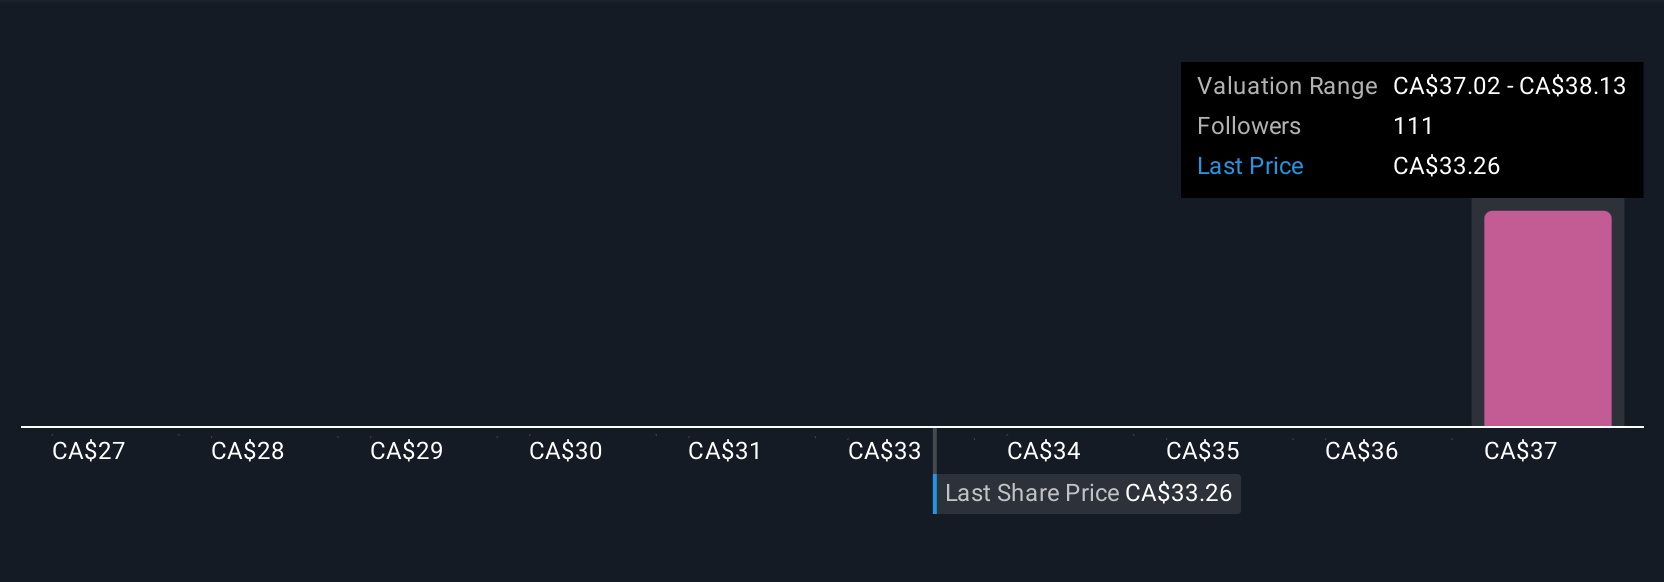
This article by Simply Wall St is general in nature. We provide commentary based on historical data and analyst forecasts only using an unbiased methodology and our articles are not intended to be financial advice. It does not constitute a recommendation to buy or sell any stock, and does not take account of your objectives, or your financial situation. We aim to bring you long-term focused analysis driven by fundamental data. Note that our analysis may not factor in the latest price-sensitive company announcements or qualitative material. Simply Wall St has no position in any stocks mentioned.
Have feedback on this article? Concerned about the content? Get in touch with us directly. Alternatively, email editorial-team@simplywallst.com