
- PREMIUM
- LIVE QUOTES
- INSTITUTIONS
 Index Options
 State Street
 CME Group
 Nasdaq
 Cboe
Cboe TradingView
 Wall Street Journal
Are Strong Financial Prospects The Force That Is Driving The Momentum In Sanlorenzo S.p.A.'s BIT:SL) Stock?

Sanlorenzo's (BIT:SL) stock is up by a considerable 7.0% over the past month. Since the market usually pay for a company’s long-term fundamentals, we decided to study the company’s key performance indicators to see if they could be influencing the market. Specifically, we decided to study Sanlorenzo's ROE in this article.
ROE or return on equity is a useful tool to assess how effectively a company can generate returns on the investment it received from its shareholders. In simpler terms, it measures the profitability of a company in relation to shareholder's equity.
How Do You Calculate Return On Equity?
The formula for ROE is:
Return on Equity = Net Profit (from continuing operations) ÷ Shareholders' Equity
So, based on the above formula, the ROE for Sanlorenzo is:
23% = €105m ÷ €461m (Based on the trailing twelve months to March 2025).
The 'return' is the income the business earned over the last year. That means that for every €1 worth of shareholders' equity, the company generated €0.23 in profit.
View our latest analysis for Sanlorenzo
Why Is ROE Important For Earnings Growth?
So far, we've learned that ROE is a measure of a company's profitability. Based on how much of its profits the company chooses to reinvest or "retain", we are then able to evaluate a company's future ability to generate profits. Assuming all else is equal, companies that have both a higher return on equity and higher profit retention are usually the ones that have a higher growth rate when compared to companies that don't have the same features.
Sanlorenzo's Earnings Growth And 23% ROE
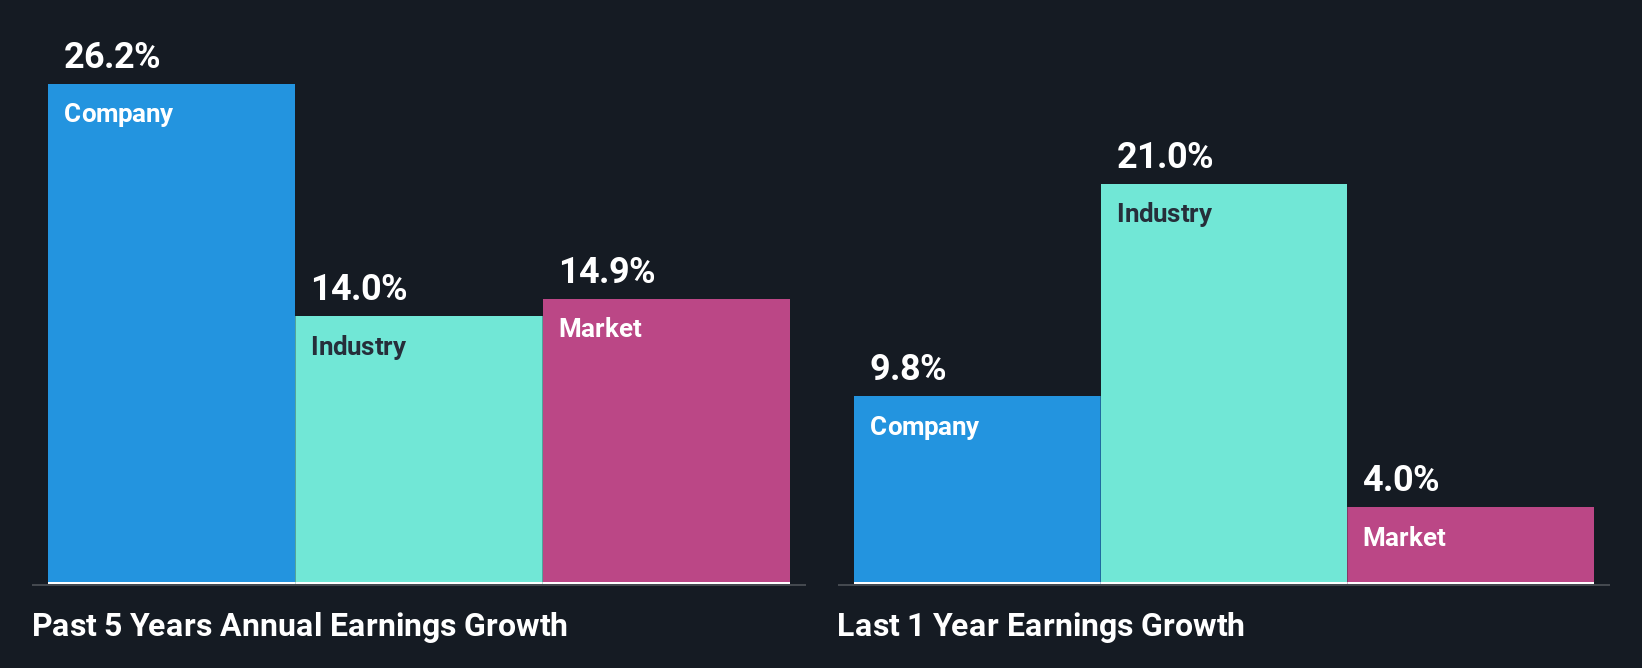
To begin with, Sanlorenzo seems to have a respectable ROE. Further, the company's ROE compares quite favorably to the industry average of 12%. This certainly adds some context to Sanlorenzo's exceptional 26% net income growth seen over the past five years. However, there could also be other causes behind this growth. Such as - high earnings retention or an efficient management in place.
As a next step, we compared Sanlorenzo's net income growth with the industry, and pleasingly, we found that the growth seen by the company is higher than the average industry growth of 14%.
The basis for attaching value to a company is, to a great extent, tied to its earnings growth. The investor should try to establish if the expected growth or decline in earnings, whichever the case may be, is priced in. By doing so, they will have an idea if the stock is headed into clear blue waters or if swampy waters await. What is SL worth today? The intrinsic value infographic in our free research report helps visualize whether SL is currently mispriced by the market.
Is Sanlorenzo Making Efficient Use Of Its Profits?
Sanlorenzo has a three-year median payout ratio of 33% (where it is retaining 67% of its income) which is not too low or not too high. This suggests that its dividend is well covered, and given the high growth we discussed above, it looks like Sanlorenzo is reinvesting its earnings efficiently.
Besides, Sanlorenzo has been paying dividends over a period of four years. This shows that the company is committed to sharing profits with its shareholders. Based on the latest analysts' estimates, we found that the company's future payout ratio over the next three years is expected to hold steady at 34%. As a result, Sanlorenzo's ROE is not expected to change by much either, which we inferred from the analyst estimate of 19% for future ROE.
Conclusion
On the whole, we feel that Sanlorenzo's performance has been quite good. Specifically, we like that the company is reinvesting a huge chunk of its profits at a high rate of return. This of course has caused the company to see substantial growth in its earnings. That being so, a study of the latest analyst forecasts show that the company is expected to see a slowdown in its future earnings growth. To know more about the latest analysts predictions for the company, check out this visualization of analyst forecasts for the company.
Have feedback on this article? Concerned about the content? Get in touch with us directly. Alternatively, email editorial-team (at) simplywallst.com.
This article by Simply Wall St is general in nature. We provide commentary based on historical data and analyst forecasts only using an unbiased methodology and our articles are not intended to be financial advice. It does not constitute a recommendation to buy or sell any stock, and does not take account of your objectives, or your financial situation. We aim to bring you long-term focused analysis driven by fundamental data. Note that our analysis may not factor in the latest price-sensitive company announcements or qualitative material. Simply Wall St has no position in any stocks mentioned.