
public companies who own 67% along with institutions invested in L&T Finance Limited (NSE:LTF) saw increase in their holdings value last week
Key Insights
- The considerable ownership by public companies in L&T Finance indicates that they collectively have a greater say in management and business strategy
- The largest shareholder of the company is Larsen & Toubro Limited with a 67% stake
- Institutional ownership in L&T Finance is 22%
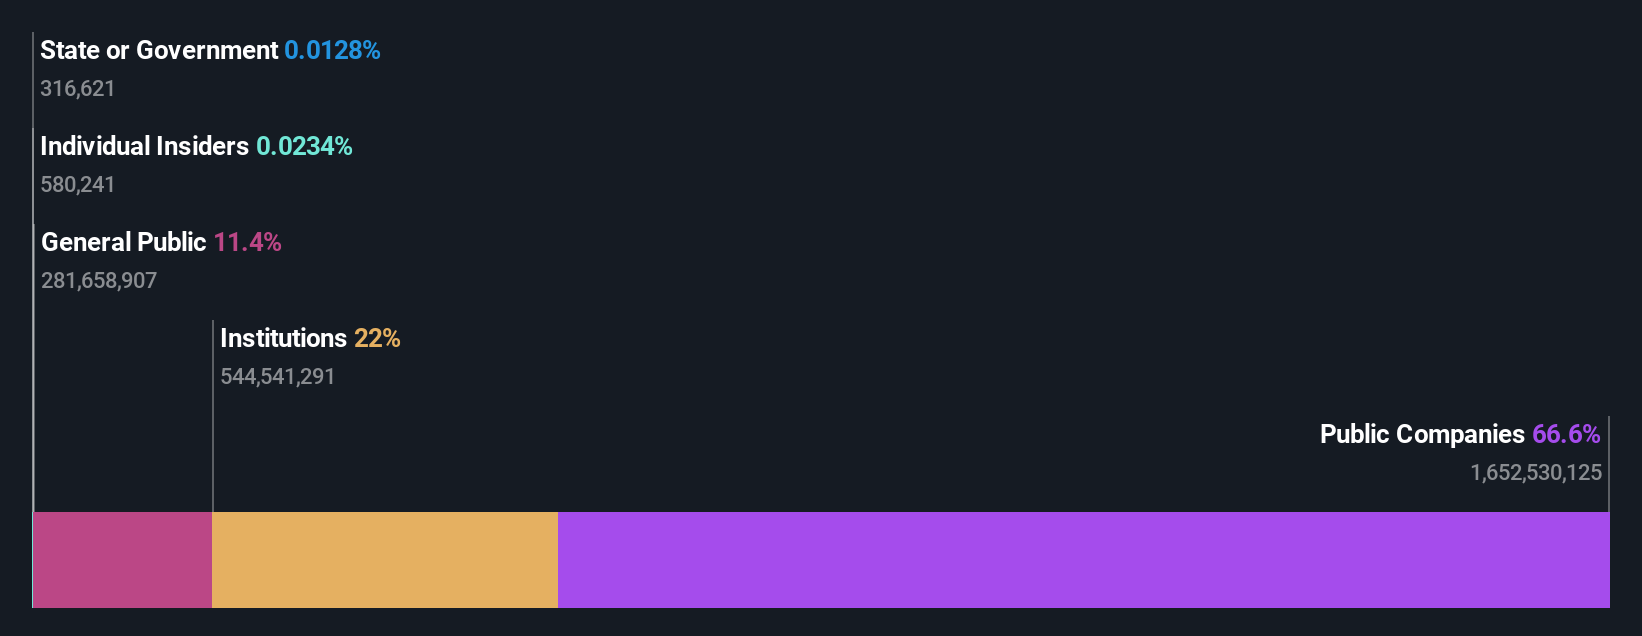
If you want to know who really controls L&T Finance Limited (NSE:LTF), then you'll have to look at the makeup of its share registry. The group holding the most number of shares in the company, around 67% to be precise, is public companies. That is, the group stands to benefit the most if the stock rises (or lose the most if there is a downturn).
Following a 9.7% increase in the stock price last week, public companies profited the most, but institutions who own 22% stock also stood to gain from the increase.
In the chart below, we zoom in on the different ownership groups of L&T Finance.
See our latest analysis for L&T Finance
What Does The Institutional Ownership Tell Us About L&T Finance?
Institutions typically measure themselves against a benchmark when reporting to their own investors, so they often become more enthusiastic about a stock once it's included in a major index. We would expect most companies to have some institutions on the register, especially if they are growing.
We can see that L&T Finance does have institutional investors; and they hold a good portion of the company's stock. This implies the analysts working for those institutions have looked at the stock and they like it. But just like anyone else, they could be wrong. When multiple institutions own a stock, there's always a risk that they are in a 'crowded trade'. When such a trade goes wrong, multiple parties may compete to sell stock fast. This risk is higher in a company without a history of growth. You can see L&T Finance's historic earnings and revenue below, but keep in mind there's always more to the story.

We note that hedge funds don't have a meaningful investment in L&T Finance. The company's largest shareholder is Larsen & Toubro Limited, with ownership of 67%. This essentially means that they have extensive influence, if not outright control, over the future of the corporation. With 2.9% and 2.4% of the shares outstanding respectively, Mirae Asset Global Investments Co., Ltd. and BNP Paribas Arbitrage Sa, Asset Management Arm are the second and third largest shareholders.
While studying institutional ownership for a company can add value to your research, it is also a good practice to research analyst recommendations to get a deeper understand of a stock's expected performance. Quite a few analysts cover the stock, so you could look into forecast growth quite easily.
Insider Ownership Of L&T Finance
While the precise definition of an insider can be subjective, almost everyone considers board members to be insiders. Management ultimately answers to the board. However, it is not uncommon for managers to be executive board members, especially if they are a founder or the CEO.
Insider ownership is positive when it signals leadership are thinking like the true owners of the company. However, high insider ownership can also give immense power to a small group within the company. This can be negative in some circumstances.
Our information suggests that L&T Finance Limited insiders own under 1% of the company. Keep in mind that it's a big company, and the insiders own ₹126m worth of shares. The absolute value might be more important than the proportional share. Arguably, recent buying and selling is just as important to consider. You can click here to see if insiders have been buying or selling.
General Public Ownership
The general public, who are usually individual investors, hold a 11% stake in L&T Finance. While this size of ownership may not be enough to sway a policy decision in their favour, they can still make a collective impact on company policies.
Public Company Ownership
It appears to us that public companies own 67% of L&T Finance. This may be a strategic interest and the two companies may have related business interests. It could be that they have de-merged. This holding is probably worth investigating further.
Next Steps:
While it is well worth considering the different groups that own a company, there are other factors that are even more important. Like risks, for instance. Every company has them, and we've spotted 2 warning signs for L&T Finance (of which 1 is potentially serious!) you should know about.
If you would prefer discover what analysts are predicting in terms of future growth, do not miss this free report on analyst forecasts.
NB: Figures in this article are calculated using data from the last twelve months, which refer to the 12-month period ending on the last date of the month the financial statement is dated. This may not be consistent with full year annual report figures.
Have feedback on this article? Concerned about the content? Get in touch with us directly. Alternatively, email editorial-team (at) simplywallst.com.
This article by Simply Wall St is general in nature. We provide commentary based on historical data and analyst forecasts only using an unbiased methodology and our articles are not intended to be financial advice. It does not constitute a recommendation to buy or sell any stock, and does not take account of your objectives, or your financial situation. We aim to bring you long-term focused analysis driven by fundamental data. Note that our analysis may not factor in the latest price-sensitive company announcements or qualitative material. Simply Wall St has no position in any stocks mentioned.