
While public companies own 30% of Doosan Enerbility Co., Ltd. (KRX:034020), individual investors are its largest shareholders with 50% ownership
Key Insights
- Doosan Enerbility's significant individual investors ownership suggests that the key decisions are influenced by shareholders from the larger public
- The top 25 shareholders own 48% of the company
- Institutional ownership in Doosan Enerbility is 19%
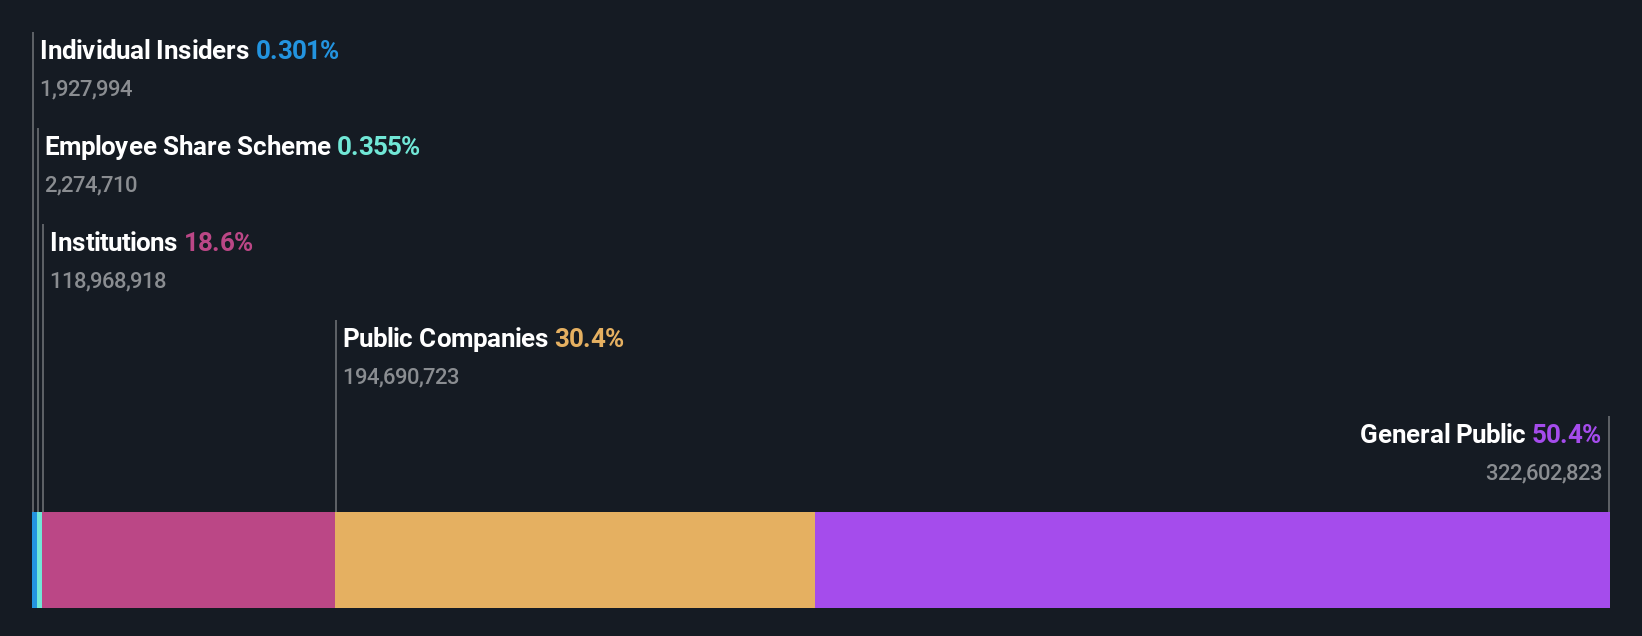
To get a sense of who is truly in control of Doosan Enerbility Co., Ltd. (KRX:034020), it is important to understand the ownership structure of the business. And the group that holds the biggest piece of the pie are individual investors with 50% ownership. In other words, the group stands to gain the most (or lose the most) from their investment into the company.
Meanwhile, public companies make up 30% of the company’s shareholders.
In the chart below, we zoom in on the different ownership groups of Doosan Enerbility.
Check out our latest analysis for Doosan Enerbility
What Does The Institutional Ownership Tell Us About Doosan Enerbility?
Institutional investors commonly compare their own returns to the returns of a commonly followed index. So they generally do consider buying larger companies that are included in the relevant benchmark index.
Doosan Enerbility already has institutions on the share registry. Indeed, they own a respectable stake in the company. This can indicate that the company has a certain degree of credibility in the investment community. However, it is best to be wary of relying on the supposed validation that comes with institutional investors. They too, get it wrong sometimes. When multiple institutions own a stock, there's always a risk that they are in a 'crowded trade'. When such a trade goes wrong, multiple parties may compete to sell stock fast. This risk is higher in a company without a history of growth. You can see Doosan Enerbility's historic earnings and revenue below, but keep in mind there's always more to the story.

We note that hedge funds don't have a meaningful investment in Doosan Enerbility. Looking at our data, we can see that the largest shareholder is Doosan Corporation with 30% of shares outstanding. In comparison, the second and third largest shareholders hold about 8.0% and 2.8% of the stock.
A deeper look at our ownership data shows that the top 25 shareholders collectively hold less than half of the register, suggesting a large group of small holders where no single shareholder has a majority.
While it makes sense to study institutional ownership data for a company, it also makes sense to study analyst sentiments to know which way the wind is blowing. There are a reasonable number of analysts covering the stock, so it might be useful to find out their aggregate view on the future.
Insider Ownership Of Doosan Enerbility
The definition of an insider can differ slightly between different countries, but members of the board of directors always count. The company management answer to the board and the latter should represent the interests of shareholders. Notably, sometimes top-level managers are on the board themselves.
Most consider insider ownership a positive because it can indicate the board is well aligned with other shareholders. However, on some occasions too much power is concentrated within this group.
Our most recent data indicates that insiders own less than 1% of Doosan Enerbility Co., Ltd.. Being so large, we would not expect insiders to own a large proportion of the stock. Collectively, they own ₩126b of stock. Arguably recent buying and selling is just as important to consider. You can click here to see if insiders have been buying or selling.
General Public Ownership
The general public, mostly comprising of individual investors, collectively holds 50% of Doosan Enerbility shares. This size of ownership gives investors from the general public some collective power. They can and probably do influence decisions on executive compensation, dividend policies and proposed business acquisitions.
Public Company Ownership
It appears to us that public companies own 30% of Doosan Enerbility. This may be a strategic interest and the two companies may have related business interests. It could be that they have de-merged. This holding is probably worth investigating further.
Next Steps:
While it is well worth considering the different groups that own a company, there are other factors that are even more important. To that end, you should be aware of the 1 warning sign we've spotted with Doosan Enerbility .
If you are like me, you may want to think about whether this company will grow or shrink. Luckily, you can check this free report showing analyst forecasts for its future.
NB: Figures in this article are calculated using data from the last twelve months, which refer to the 12-month period ending on the last date of the month the financial statement is dated. This may not be consistent with full year annual report figures.
Have feedback on this article? Concerned about the content? Get in touch with us directly. Alternatively, email editorial-team (at) simplywallst.com.
This article by Simply Wall St is general in nature. We provide commentary based on historical data and analyst forecasts only using an unbiased methodology and our articles are not intended to be financial advice. It does not constitute a recommendation to buy or sell any stock, and does not take account of your objectives, or your financial situation. We aim to bring you long-term focused analysis driven by fundamental data. Note that our analysis may not factor in the latest price-sensitive company announcements or qualitative material. Simply Wall St has no position in any stocks mentioned.