
- PREMIUM
- LIVE QUOTES
- INSTITUTIONS
 Index Options
 State Street
 CME Group
 Nasdaq
 Cboe
Cboe TradingView
 Wall Street Journal
IOI Corporation Berhad's (KLSE:IOICORP) Intrinsic Value Is Potentially 21% Below Its Share Price

Key Insights
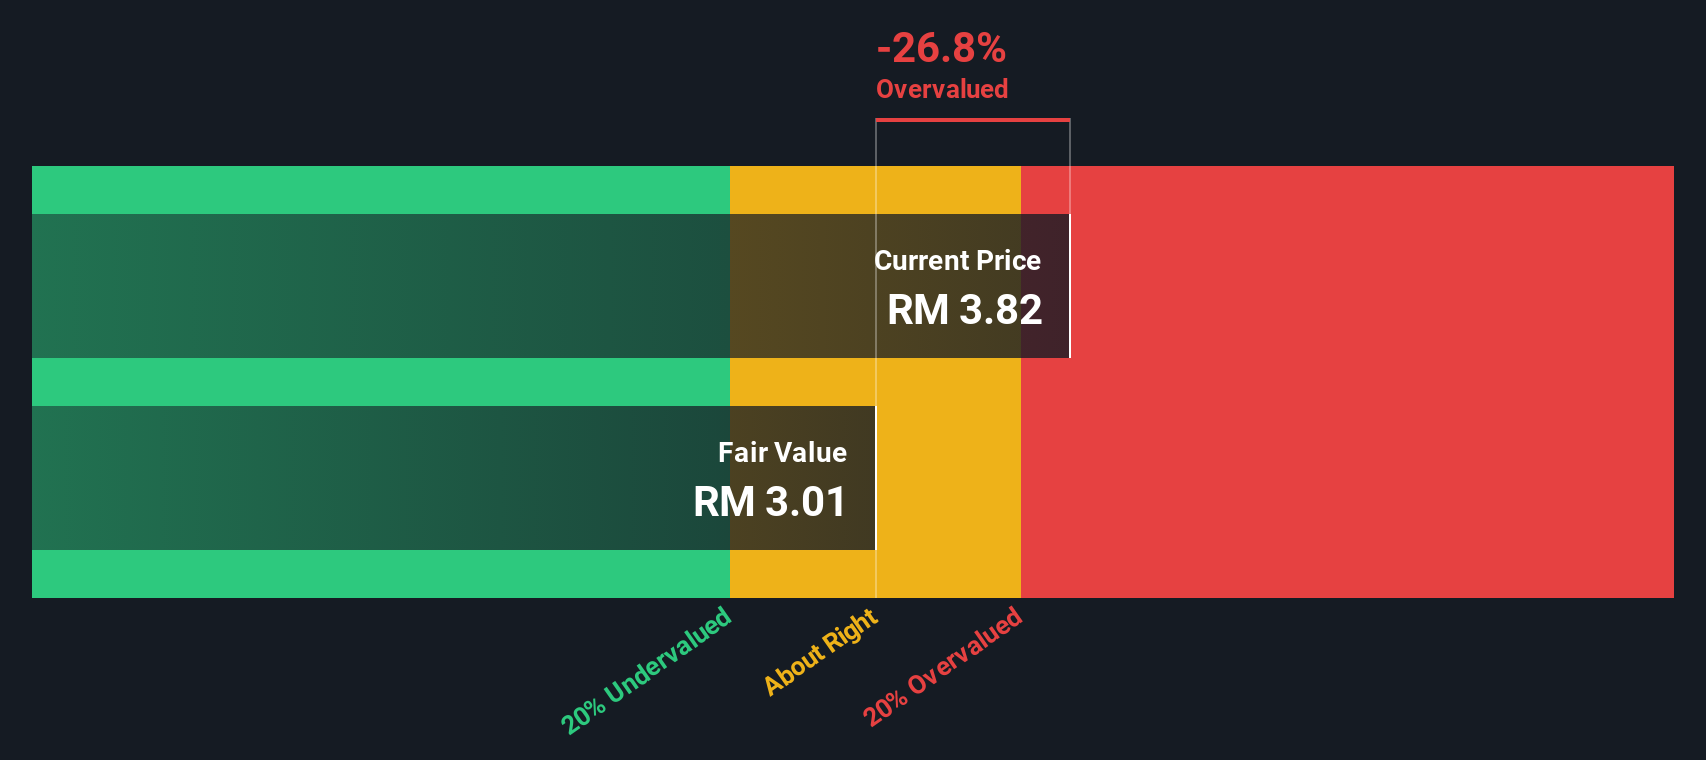
- Using the 2 Stage Free Cash Flow to Equity, IOI Corporation Berhad fair value estimate is RM3.01
- IOI Corporation Berhad's RM3.82 share price signals that it might be 27% overvalued
- The RM4.06 analyst price target for IOICORP is 35% more than our estimate of fair value
Today we will run through one way of estimating the intrinsic value of IOI Corporation Berhad (KLSE:IOICORP) by taking the forecast future cash flows of the company and discounting them back to today's value. This will be done using the Discounted Cash Flow (DCF) model. Believe it or not, it's not too difficult to follow, as you'll see from our example!
We would caution that there are many ways of valuing a company and, like the DCF, each technique has advantages and disadvantages in certain scenarios. If you want to learn more about discounted cash flow, the rationale behind this calculation can be read in detail in the Simply Wall St analysis model.
The Calculation
We're using the 2-stage growth model, which simply means we take in account two stages of company's growth. In the initial period the company may have a higher growth rate and the second stage is usually assumed to have a stable growth rate. To start off with, we need to estimate the next ten years of cash flows. Where possible we use analyst estimates, but when these aren't available we extrapolate the previous free cash flow (FCF) from the last estimate or reported value. We assume companies with shrinking free cash flow will slow their rate of shrinkage, and that companies with growing free cash flow will see their growth rate slow, over this period. We do this to reflect that growth tends to slow more in the early years than it does in later years.
Generally we assume that a dollar today is more valuable than a dollar in the future, so we discount the value of these future cash flows to their estimated value in today's dollars:
10-year free cash flow (FCF) forecast
| 2026 | 2027 | 2028 | 2029 | 2030 | 2031 | 2032 | 2033 | 2034 | 2035 | |
| Levered FCF (MYR, Millions) | RM1.01b | RM1.00b | RM1.01b | RM1.02b | RM1.04b | RM1.07b | RM1.10b | RM1.14b | RM1.18b | RM1.22b |
| Growth Rate Estimate Source | Analyst x4 | Analyst x4 | Est @ 0.61% | Est @ 1.53% | Est @ 2.17% | Est @ 2.62% | Est @ 2.94% | Est @ 3.16% | Est @ 3.31% | Est @ 3.42% |
| Present Value (MYR, Millions) Discounted @ 8.5% | RM930 | RM851 | RM789 | RM739 | RM696 | RM659 | RM625 | RM595 | RM566 | RM540 |
("Est" = FCF growth rate estimated by Simply Wall St)
Present Value of 10-year Cash Flow (PVCF) = RM7.0b
The second stage is also known as Terminal Value, this is the business's cash flow after the first stage. For a number of reasons a very conservative growth rate is used that cannot exceed that of a country's GDP growth. In this case we have used the 5-year average of the 10-year government bond yield (3.7%) to estimate future growth. In the same way as with the 10-year 'growth' period, we discount future cash flows to today's value, using a cost of equity of 8.5%.
Terminal Value (TV)= FCF2035 × (1 + g) ÷ (r – g) = RM1.2b× (1 + 3.7%) ÷ (8.5%– 3.7%) = RM26b
Present Value of Terminal Value (PVTV)= TV / (1 + r)10= RM26b÷ ( 1 + 8.5%)10= RM12b
The total value, or equity value, is then the sum of the present value of the future cash flows, which in this case is RM19b. In the final step we divide the equity value by the number of shares outstanding. Relative to the current share price of RM3.8, the company appears slightly overvalued at the time of writing. The assumptions in any calculation have a big impact on the valuation, so it is better to view this as a rough estimate, not precise down to the last cent.
The Assumptions
Now the most important inputs to a discounted cash flow are the discount rate, and of course, the actual cash flows. If you don't agree with these result, have a go at the calculation yourself and play with the assumptions. The DCF also does not consider the possible cyclicality of an industry, or a company's future capital requirements, so it does not give a full picture of a company's potential performance. Given that we are looking at IOI Corporation Berhad as potential shareholders, the cost of equity is used as the discount rate, rather than the cost of capital (or weighted average cost of capital, WACC) which accounts for debt. In this calculation we've used 8.5%, which is based on a levered beta of 0.800. Beta is a measure of a stock's volatility, compared to the market as a whole. We get our beta from the industry average beta of globally comparable companies, with an imposed limit between 0.8 and 2.0, which is a reasonable range for a stable business.
View our latest analysis for IOI Corporation Berhad
SWOT Analysis for IOI Corporation Berhad
- Earnings growth over the past year exceeded the industry.
- Debt is not viewed as a risk.
- Dividend is low compared to the top 25% of dividend payers in the Food market.
- Expensive based on P/E ratio and estimated fair value.
- Annual earnings are forecast to grow for the next 3 years.
- Dividends are not covered by cash flow.
- Annual earnings are forecast to grow slower than the Malaysian market.
Looking Ahead:
Although the valuation of a company is important, it ideally won't be the sole piece of analysis you scrutinize for a company. The DCF model is not a perfect stock valuation tool. Preferably you'd apply different cases and assumptions and see how they would impact the company's valuation. For example, changes in the company's cost of equity or the risk free rate can significantly impact the valuation. Why is the intrinsic value lower than the current share price? For IOI Corporation Berhad, we've put together three important elements you should explore:
- Risks: For example, we've discovered 1 warning sign for IOI Corporation Berhad that you should be aware of before investing here.
- Future Earnings: How does IOICORP's growth rate compare to its peers and the wider market? Dig deeper into the analyst consensus number for the upcoming years by interacting with our free analyst growth expectation chart.
- Other High Quality Alternatives: Do you like a good all-rounder? Explore our interactive list of high quality stocks to get an idea of what else is out there you may be missing!
PS. The Simply Wall St app conducts a discounted cash flow valuation for every stock on the KLSE every day. If you want to find the calculation for other stocks just search here.
Have feedback on this article? Concerned about the content? Get in touch with us directly. Alternatively, email editorial-team (at) simplywallst.com.
This article by Simply Wall St is general in nature. We provide commentary based on historical data and analyst forecasts only using an unbiased methodology and our articles are not intended to be financial advice. It does not constitute a recommendation to buy or sell any stock, and does not take account of your objectives, or your financial situation. We aim to bring you long-term focused analysis driven by fundamental data. Note that our analysis may not factor in the latest price-sensitive company announcements or qualitative material. Simply Wall St has no position in any stocks mentioned.