
- PREMIUM
- LIVE QUOTES
- INSTITUTIONS
 Index Options
 State Street
 CME Group
 Nasdaq
 Cboe
Cboe TradingView
 Wall Street Journal
Beijer Ref AB (publ) (STO:BEIJ B) is favoured by institutional owners who hold 52% of the company
Key Insights
- Institutions' substantial holdings in Beijer Ref implies that they have significant influence over the company's share price
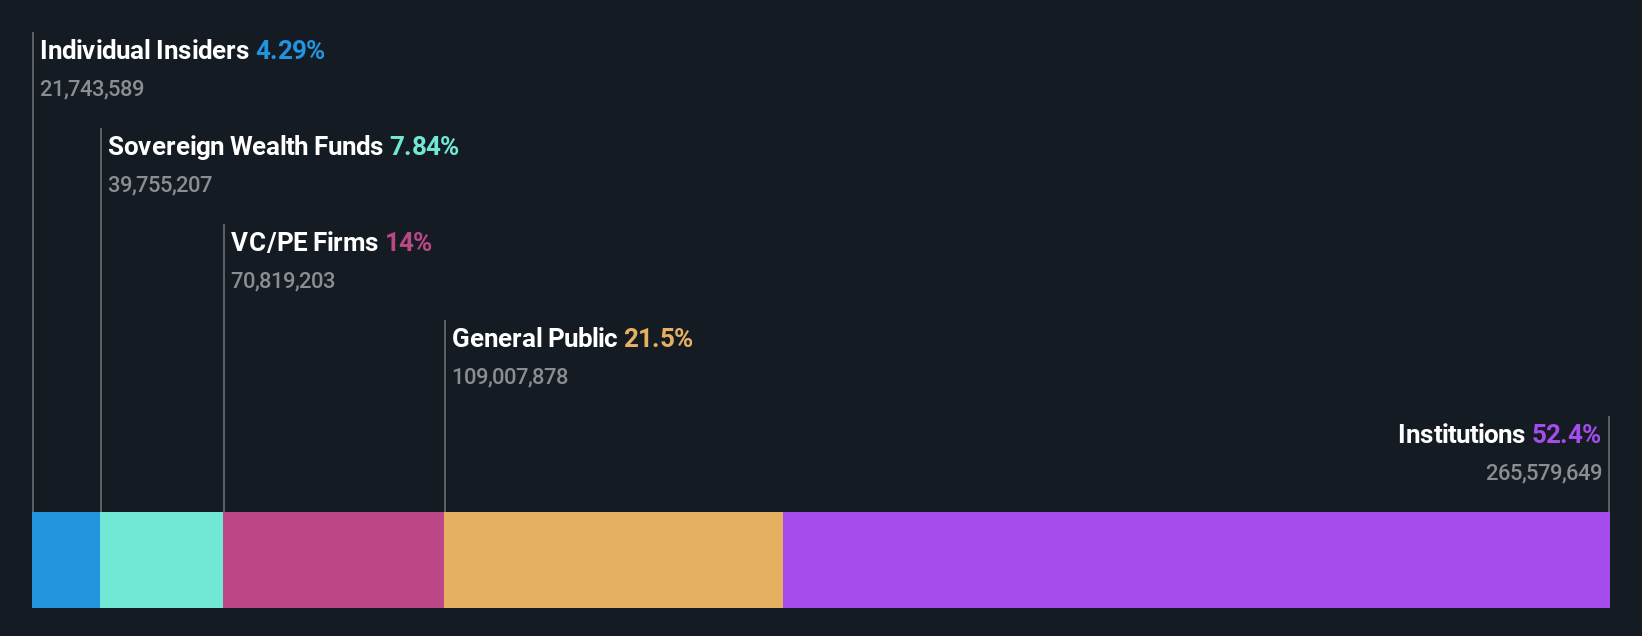
- The top 8 shareholders own 52% of the company
- Insiders have bought recently
If you want to know who really controls Beijer Ref AB (publ) (STO:BEIJ B), then you'll have to look at the makeup of its share registry. The group holding the most number of shares in the company, around 52% to be precise, is institutions. That is, the group stands to benefit the most if the stock rises (or lose the most if there is a downturn).
Because institutional owners have a huge pool of resources and liquidity, their investing decisions tend to carry a great deal of weight, especially with individual investors. As a result, a sizeable amount of institutional money invested in a firm is generally viewed as a positive attribute.
In the chart below, we zoom in on the different ownership groups of Beijer Ref.
See our latest analysis for Beijer Ref
What Does The Institutional Ownership Tell Us About Beijer Ref?
Many institutions measure their performance against an index that approximates the local market. So they usually pay more attention to companies that are included in major indices.
As you can see, institutional investors have a fair amount of stake in Beijer Ref. This can indicate that the company has a certain degree of credibility in the investment community. However, it is best to be wary of relying on the supposed validation that comes with institutional investors. They too, get it wrong sometimes. It is not uncommon to see a big share price drop if two large institutional investors try to sell out of a stock at the same time. So it is worth checking the past earnings trajectory of Beijer Ref, (below). Of course, keep in mind that there are other factors to consider, too.
Since institutional investors own more than half the issued stock, the board will likely have to pay attention to their preferences. Hedge funds don't have many shares in Beijer Ref. Our data shows that Eqt Fund Management S.à R.L. is the largest shareholder with 14% of shares outstanding. In comparison, the second and third largest shareholders hold about 7.8% and 7.0% of the stock.
We also observed that the top 8 shareholders account for more than half of the share register, with a few smaller shareholders to balance the interests of the larger ones to a certain extent.
While studying institutional ownership for a company can add value to your research, it is also a good practice to research analyst recommendations to get a deeper understand of a stock's expected performance. There are a reasonable number of analysts covering the stock, so it might be useful to find out their aggregate view on the future.
Insider Ownership Of Beijer Ref
The definition of an insider can differ slightly between different countries, but members of the board of directors always count. Management ultimately answers to the board. However, it is not uncommon for managers to be executive board members, especially if they are a founder or the CEO.
Insider ownership is positive when it signals leadership are thinking like the true owners of the company. However, high insider ownership can also give immense power to a small group within the company. This can be negative in some circumstances.
Our most recent data indicates that insiders own some shares in Beijer Ref AB (publ). It is a very large company, and board members collectively own kr3.7b worth of shares (at current prices). It is good to see this level of investment. You can check here to see if those insiders have been buying recently.
General Public Ownership
With a 22% ownership, the general public, mostly comprising of individual investors, have some degree of sway over Beijer Ref. This size of ownership, while considerable, may not be enough to change company policy if the decision is not in sync with other large shareholders.
Private Equity Ownership
Private equity firms hold a 14% stake in Beijer Ref. This suggests they can be influential in key policy decisions. Some might like this, because private equity are sometimes activists who hold management accountable. But other times, private equity is selling out, having taking the company public.
Next Steps:
While it is well worth considering the different groups that own a company, there are other factors that are even more important.
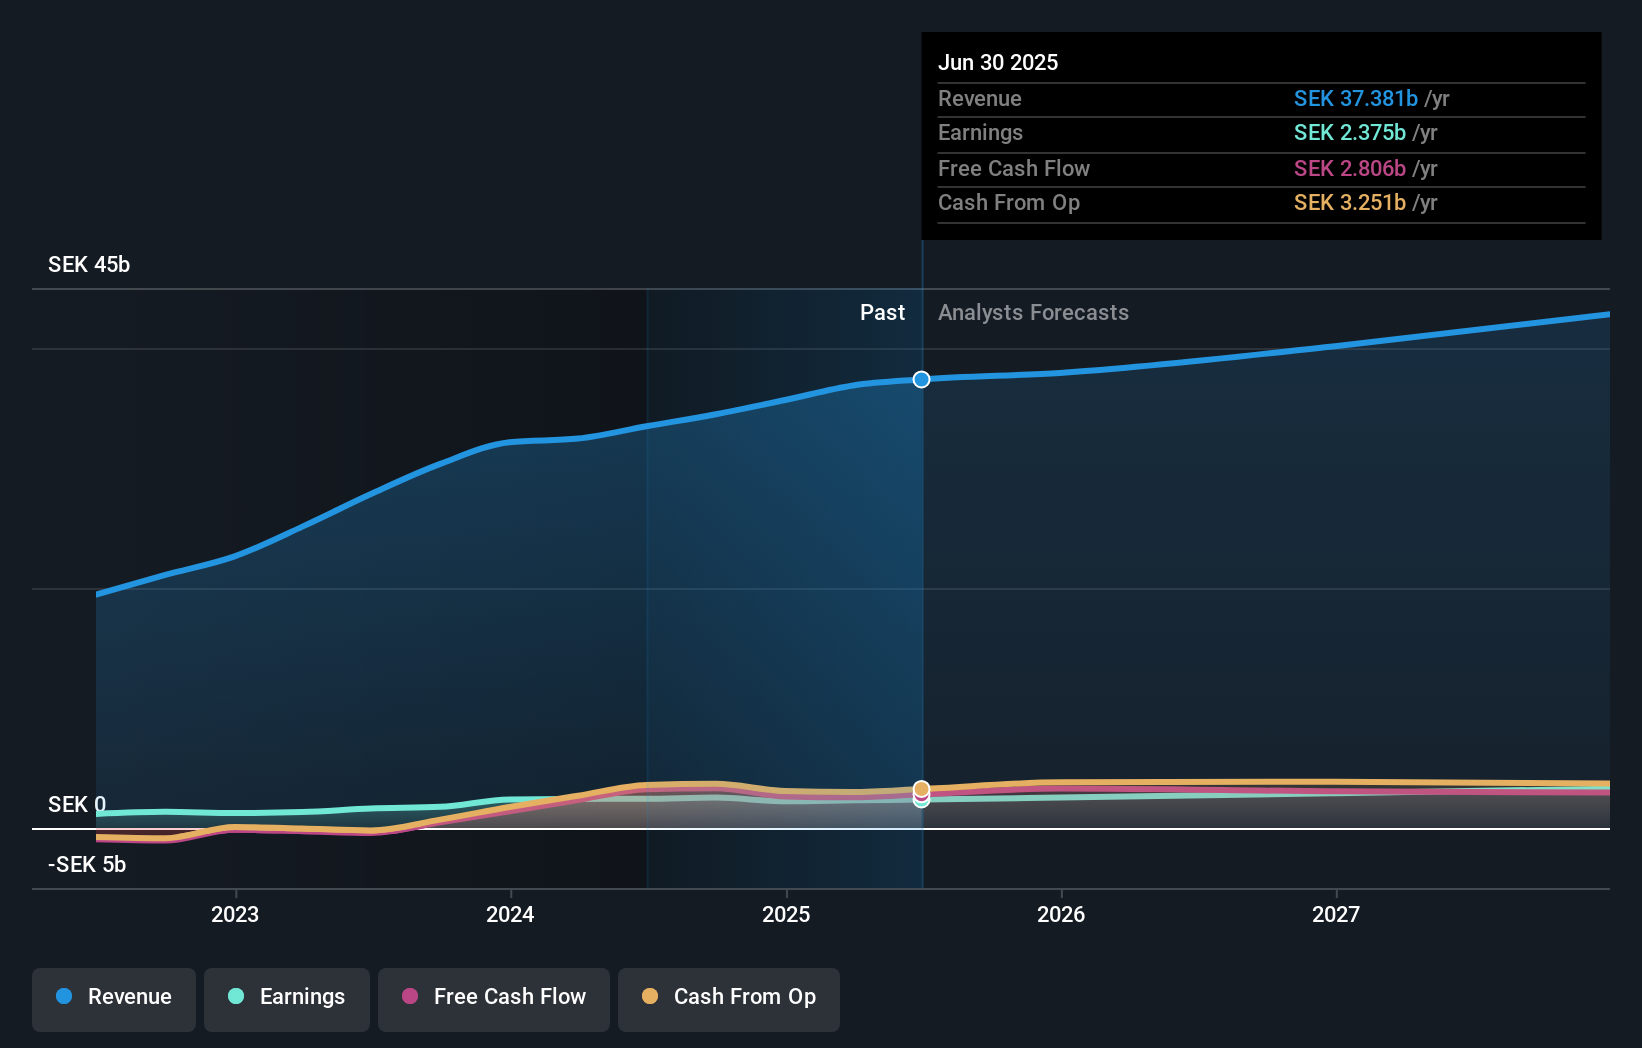
Many find it useful to take an in depth look at how a company has performed in the past. You can access this detailed graph of past earnings, revenue and cash flow.
If you are like me, you may want to think about whether this company will grow or shrink. Luckily, you can check this free report showing analyst forecasts for its future.
NB: Figures in this article are calculated using data from the last twelve months, which refer to the 12-month period ending on the last date of the month the financial statement is dated. This may not be consistent with full year annual report figures.
Have feedback on this article? Concerned about the content? Get in touch with us directly. Alternatively, email editorial-team (at) simplywallst.com.
This article by Simply Wall St is general in nature. We provide commentary based on historical data and analyst forecasts only using an unbiased methodology and our articles are not intended to be financial advice. It does not constitute a recommendation to buy or sell any stock, and does not take account of your objectives, or your financial situation. We aim to bring you long-term focused analysis driven by fundamental data. Note that our analysis may not factor in the latest price-sensitive company announcements or qualitative material. Simply Wall St has no position in any stocks mentioned.