
Lancashire Holdings Limited's (LON:LRE) high institutional ownership speaks for itself as stock continues to impress, up 4.3% over last week
Key Insights
- Significantly high institutional ownership implies Lancashire Holdings' stock price is sensitive to their trading actions
- A total of 10 investors have a majority stake in the company with 51% ownership
- Recent purchases by insiders
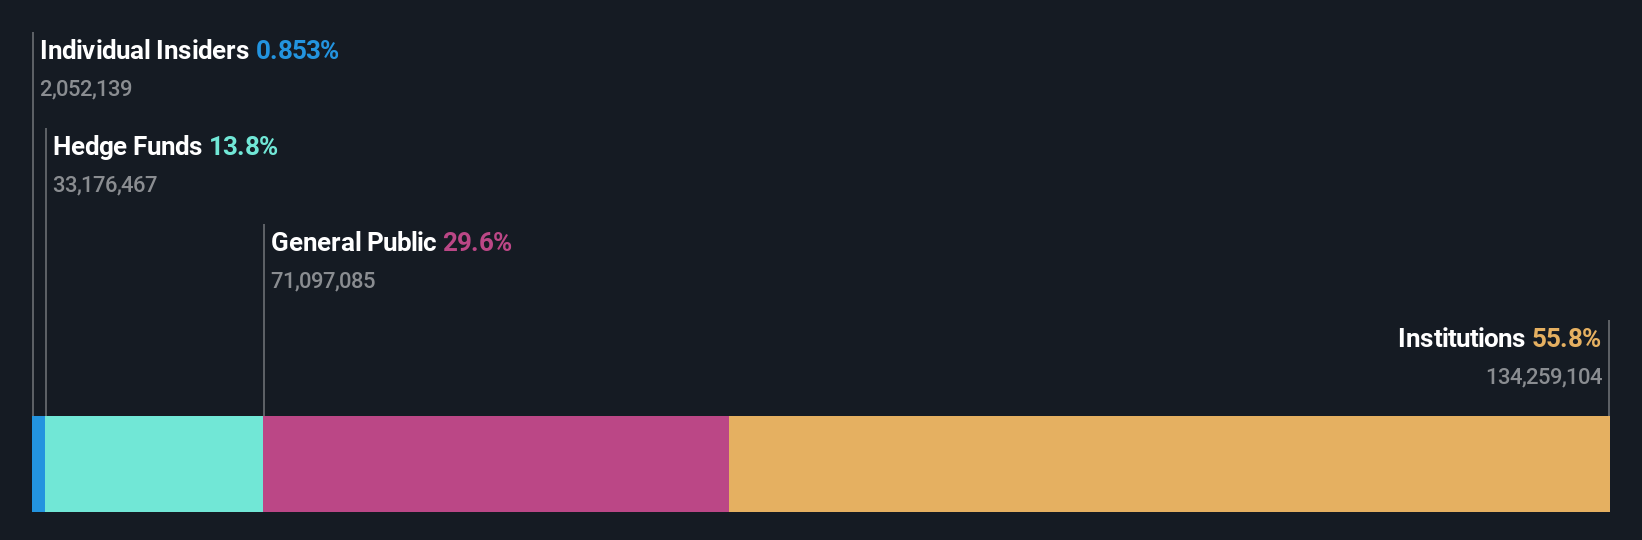
Every investor in Lancashire Holdings Limited (LON:LRE) should be aware of the most powerful shareholder groups. And the group that holds the biggest piece of the pie are institutions with 56% ownership. In other words, the group stands to gain the most (or lose the most) from their investment into the company.
Last week’s 4.3% gain means that institutional investors were on the positive end of the spectrum even as the company has shown strong longer-term trends. The gains from last week would have further boosted the one-year return to shareholders which currently stand at 23%.
Let's delve deeper into each type of owner of Lancashire Holdings, beginning with the chart below.
Check out our latest analysis for Lancashire Holdings
What Does The Institutional Ownership Tell Us About Lancashire Holdings?
Institutions typically measure themselves against a benchmark when reporting to their own investors, so they often become more enthusiastic about a stock once it's included in a major index. We would expect most companies to have some institutions on the register, especially if they are growing.
As you can see, institutional investors have a fair amount of stake in Lancashire Holdings. This suggests some credibility amongst professional investors. But we can't rely on that fact alone since institutions make bad investments sometimes, just like everyone does. It is not uncommon to see a big share price drop if two large institutional investors try to sell out of a stock at the same time. So it is worth checking the past earnings trajectory of Lancashire Holdings, (below). Of course, keep in mind that there are other factors to consider, too.

Investors should note that institutions actually own more than half the company, so they can collectively wield significant power. It looks like hedge funds own 14% of Lancashire Holdings shares. That catches my attention because hedge funds sometimes try to influence management, or bring about changes that will create near term value for shareholders. The company's largest shareholder is GLG Partners, Inc., with ownership of 7.1%. The second and third largest shareholders are GLG Partners LP and Baillie Gifford & Co., with an equal amount of shares to their name at 6.7%.
We also observed that the top 10 shareholders account for more than half of the share register, with a few smaller shareholders to balance the interests of the larger ones to a certain extent.
While it makes sense to study institutional ownership data for a company, it also makes sense to study analyst sentiments to know which way the wind is blowing. There are a reasonable number of analysts covering the stock, so it might be useful to find out their aggregate view on the future.
Insider Ownership Of Lancashire Holdings
While the precise definition of an insider can be subjective, almost everyone considers board members to be insiders. Management ultimately answers to the board. However, it is not uncommon for managers to be executive board members, especially if they are a founder or the CEO.
I generally consider insider ownership to be a good thing. However, on some occasions it makes it more difficult for other shareholders to hold the board accountable for decisions.
Our most recent data indicates that insiders own less than 1% of Lancashire Holdings Limited. It's a big company, so even a small proportional interest can create alignment between the board and shareholders. In this case insiders own UK£13m worth of shares. It is always good to see at least some insider ownership, but it might be worth checking if those insiders have been selling.
General Public Ownership
The general public, who are usually individual investors, hold a 30% stake in Lancashire Holdings. This size of ownership, while considerable, may not be enough to change company policy if the decision is not in sync with other large shareholders.
Next Steps:
While it is well worth considering the different groups that own a company, there are other factors that are even more important. Consider risks, for instance. Every company has them, and we've spotted 1 warning sign for Lancashire Holdings you should know about.
If you would prefer discover what analysts are predicting in terms of future growth, do not miss this free report on analyst forecasts.
NB: Figures in this article are calculated using data from the last twelve months, which refer to the 12-month period ending on the last date of the month the financial statement is dated. This may not be consistent with full year annual report figures.
Have feedback on this article? Concerned about the content? Get in touch with us directly. Alternatively, email editorial-team (at) simplywallst.com.
This article by Simply Wall St is general in nature. We provide commentary based on historical data and analyst forecasts only using an unbiased methodology and our articles are not intended to be financial advice. It does not constitute a recommendation to buy or sell any stock, and does not take account of your objectives, or your financial situation. We aim to bring you long-term focused analysis driven by fundamental data. Note that our analysis may not factor in the latest price-sensitive company announcements or qualitative material. Simply Wall St has no position in any stocks mentioned.