
- PREMIUM
- LIVE QUOTES
- INSTITUTIONS
 Index Options
 State Street
 CME Group
 Nasdaq
 Cboe
Cboe TradingView
 Wall Street Journal
Spotlight On Fuel Tech And 2 Other Noteworthy Penny Stocks
As the U.S. stock market faces a pause in its rally, with major indices like the S&P 500 and Nasdaq Composite experiencing slight declines amid concerns over tariffs and economic outlooks, investors are increasingly looking at alternative opportunities. Penny stocks, though considered niche investments today, continue to attract attention as they often represent smaller or newer companies with potential for significant growth. In this context, we examine three penny stocks that stand out for their financial strength and potential to offer compelling opportunities for investors seeking under-the-radar companies poised for long-term success.
Top 10 Penny Stocks In The United States
| Name | Share Price | Market Cap | Rewards & Risks |
| Waterdrop (WDH) | $1.71 | $607.59M | ✅ 4 ⚠️ 0 View Analysis > |
| WM Technology (MAPS) | $0.9155 | $158.62M | ✅ 4 ⚠️ 1 View Analysis > |
| Performance Shipping (PSHG) | $1.67 | $20.45M | ✅ 4 ⚠️ 2 View Analysis > |
| Tuniu (TOUR) | $0.9326 | $90.77M | ✅ 3 ⚠️ 2 View Analysis > |
| Cricut (CRCT) | $4.85 | $999.59M | ✅ 2 ⚠️ 1 View Analysis > |
| Riverview Bancorp (RVSB) | $4.90 | $101.94M | ✅ 3 ⚠️ 1 View Analysis > |
| BAB (BABB) | $0.89 | $6.48M | ✅ 2 ⚠️ 3 View Analysis > |
| Lifetime Brands (LCUT) | $4.13 | $93.47M | ✅ 3 ⚠️ 3 View Analysis > |
| Resources Connection (RGP) | $4.65 | $155.03M | ✅ 3 ⚠️ 1 View Analysis > |
| TETRA Technologies (TTI) | $4.00 | $529.63M | ✅ 3 ⚠️ 2 View Analysis > |
Click here to see the full list of 416 stocks from our US Penny Stocks screener.
Here's a peek at a few of the choices from the screener.
Fuel Tech (FTEK)
Simply Wall St Financial Health Rating: ★★★★★★
Overview: Fuel Tech, Inc. focuses on developing and commercializing technologies for air pollution control, process optimization, and water treatment, with a market cap of $86.18 million.
Operations: The company generates revenue through two main segments: Fuel Chem, which accounts for $16.33 million, and Air Pollution Control, contributing $10.23 million.
Market Cap: $86.18M
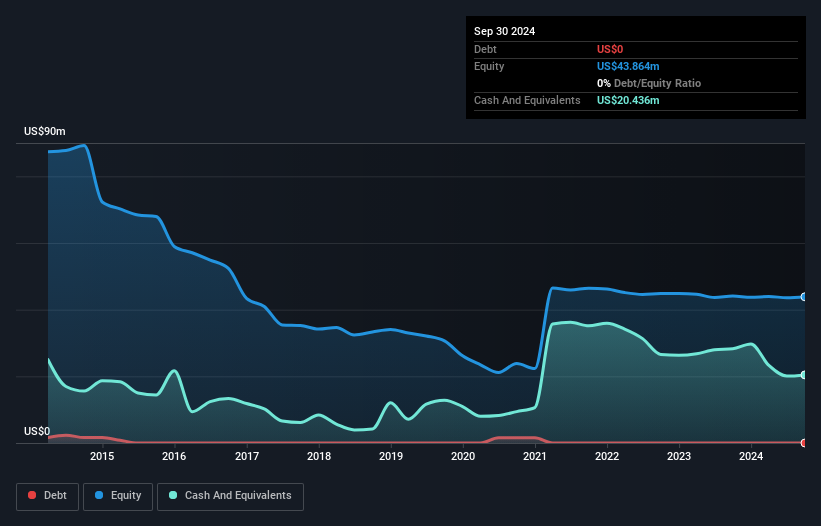
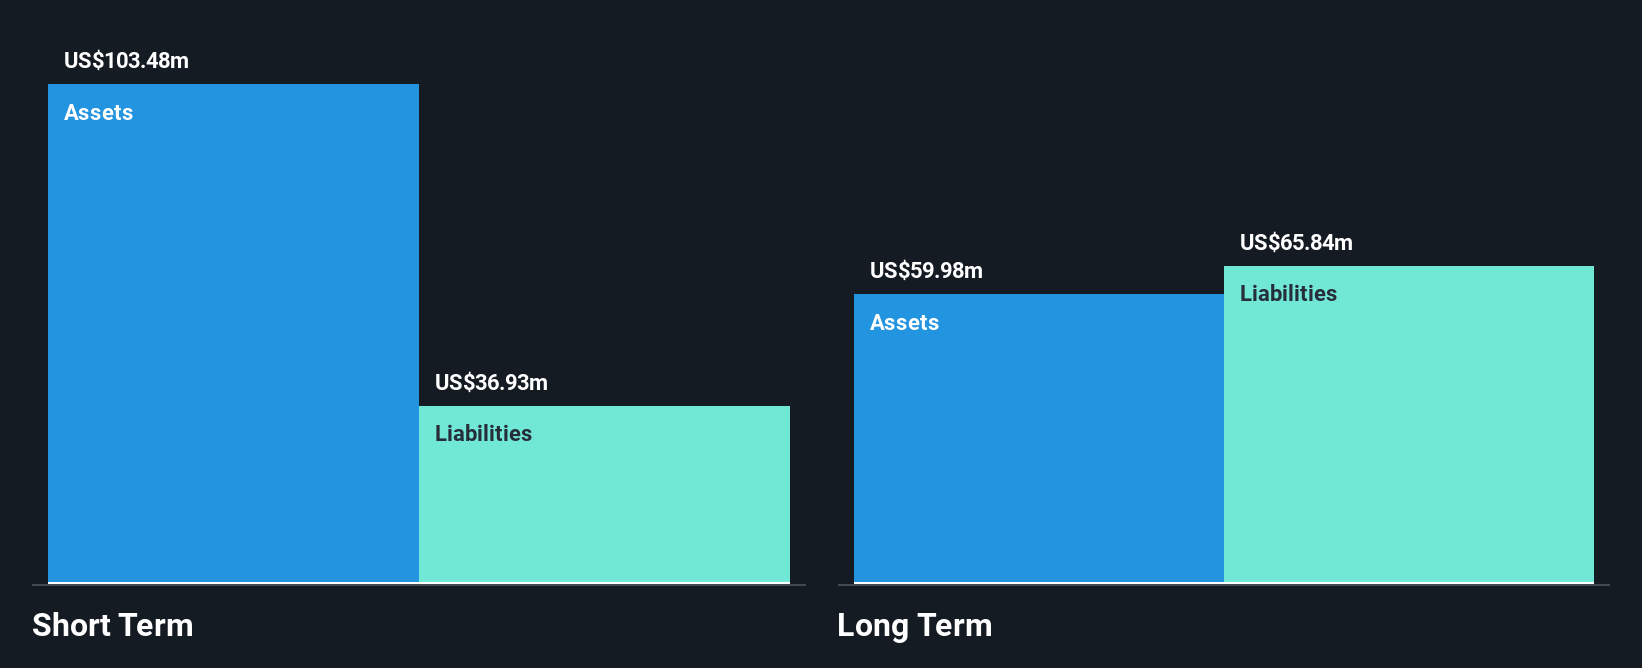
Fuel Tech, Inc. recently reported a decline in quarterly sales to US$5.56 million from US$7.04 million a year ago, with an increased net loss of US$0.689 million compared to the previous year's loss of US$0.421 million. Despite its unprofitability and volatile share price, the company has reduced losses over five years by 44.5% annually and maintains a strong financial position with short-term assets exceeding liabilities and no debt burden. The management team is experienced, and Fuel Tech has sufficient cash runway for over three years if current cash flow trends continue without significant changes in operations or market conditions.
- Click here and access our complete financial health analysis report to understand the dynamics of Fuel Tech.
- Gain insights into Fuel Tech's outlook and expected performance with our report on the company's earnings estimates.
SOPHiA GENETICS (SOPH)
Simply Wall St Financial Health Rating: ★★★★★☆
Overview: SOPHiA GENETICS SA is a cloud-native software technology company in the healthcare sector with a market cap of $220.51 million.
Operations: SOPHiA GENETICS SA has not reported any specific revenue segments.
Market Cap: $220.51M
SOPHiA GENETICS SA, with a market cap of US$220.51 million, reported second-quarter sales of US$18.32 million, up from US$15.81 million the previous year, yet net losses widened to US$22.41 million from US$15.19 million. The company has reiterated its full-year revenue guidance between $72 and $76 million for 2025 and announced a follow-on equity offering worth $50 million alongside a shelf registration filing for $200 million in securities—indicating strategic moves to bolster capital amidst ongoing unprofitability. Despite negative return on equity and increasing debt-to-equity ratio over five years, SOPHiA GENETICS maintains sufficient short-term assets to cover liabilities and an experienced board with average tenure over five years.
- Take a closer look at SOPHiA GENETICS' potential here in our financial health report.
- Review our growth performance report to gain insights into SOPHiA GENETICS' future.
Eventbrite (EB)
Simply Wall St Financial Health Rating: ★★★★★☆
Overview: Eventbrite, Inc. operates a two-sided marketplace offering self-service ticketing and marketing tools for event creators globally, with a market cap of approximately $231.09 million.
Operations: The company's revenue is primarily derived from its Internet Software & Services segment, totaling $312.65 million.
Market Cap: $231.09M
Eventbrite, Inc., with a market cap of US$231.09 million, remains unprofitable but has managed to reduce losses by 52% annually over five years. Despite significant insider selling and being dropped from several growth indices, it was added to the Russell Microcap Value Benchmark, reflecting a shift in investor perception. The company maintains a strong cash position exceeding its debt and short-term liabilities, ensuring more than three years of runway if current cash flow trends continue. Recent product updates aim to enhance event promotion for music venues while management changes suggest strategic realignments amid ongoing financial challenges.
- Click to explore a detailed breakdown of our findings in Eventbrite's financial health report.
- Learn about Eventbrite's future growth trajectory here.

Next Steps
- Unlock our comprehensive list of 416 US Penny Stocks by clicking here.
- Contemplating Other Strategies? Trump has pledged to "unleash" American oil and gas and these 22 US stocks have developments that are poised to benefit.
This article by Simply Wall St is general in nature. We provide commentary based on historical data and analyst forecasts only using an unbiased methodology and our articles are not intended to be financial advice. It does not constitute a recommendation to buy or sell any stock, and does not take account of your objectives, or your financial situation. We aim to bring you long-term focused analysis driven by fundamental data. Note that our analysis may not factor in the latest price-sensitive company announcements or qualitative material. Simply Wall St has no position in any stocks mentioned.
Have feedback on this article? Concerned about the content? Get in touch with us directly. Alternatively, email editorial-team@simplywallst.com