
- PREMIUM
- LIVE QUOTES
- INSTITUTIONS
 Index Options
 State Street
 CME Group
 Nasdaq
 Cboe
Cboe TradingView
 Wall Street Journal
Individual investors among Tudor Gold Corp.'s (CVE:TUD) largest shareholders, saw gain in holdings value after stock jumped 25% last week
Key Insights
- Tudor Gold's significant individual investors ownership suggests that the key decisions are influenced by shareholders from the larger public
- A total of 15 investors have a majority stake in the company with 44% ownership
- Recent purchases by insiders
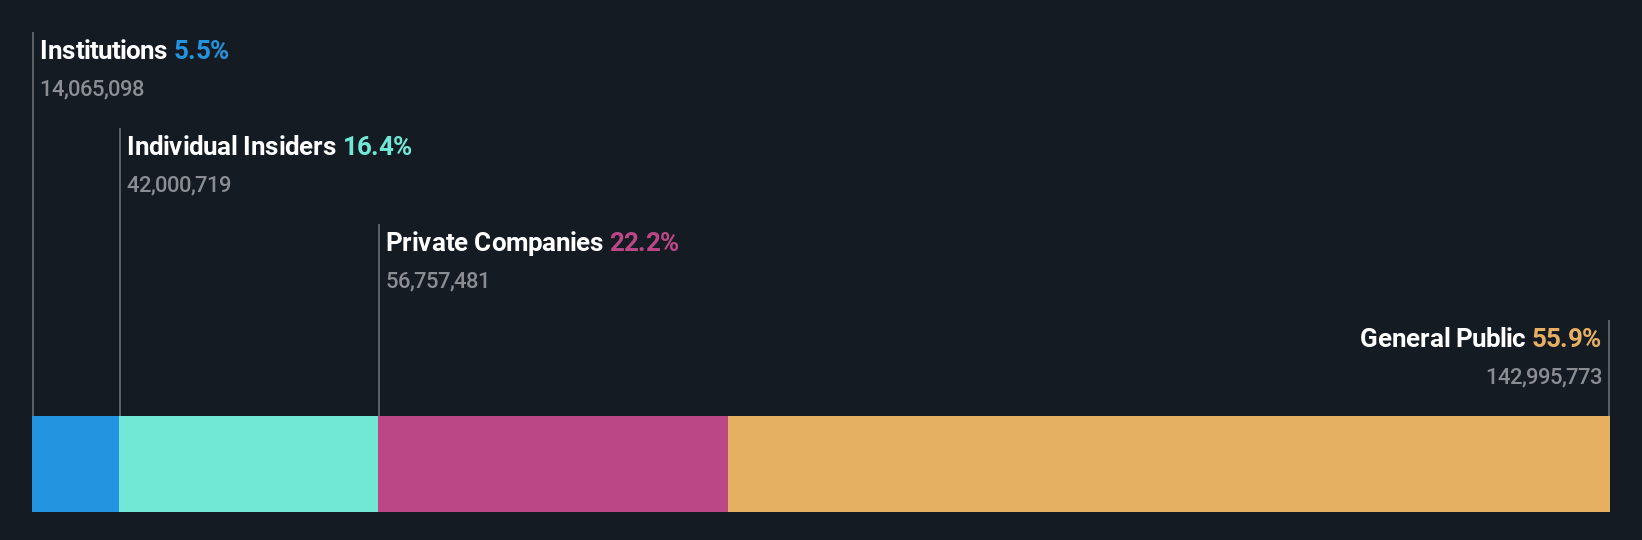
A look at the shareholders of Tudor Gold Corp. (CVE:TUD) can tell us which group is most powerful. We can see that individual investors own the lion's share in the company with 56% ownership. In other words, the group stands to gain the most (or lose the most) from their investment into the company.
As a result, individual investors were the biggest beneficiaries of last week’s 25% gain.
Let's delve deeper into each type of owner of Tudor Gold, beginning with the chart below.
Check out our latest analysis for Tudor Gold
What Does The Institutional Ownership Tell Us About Tudor Gold?
Many institutions measure their performance against an index that approximates the local market. So they usually pay more attention to companies that are included in major indices.
We can see that Tudor Gold does have institutional investors; and they hold a good portion of the company's stock. This implies the analysts working for those institutions have looked at the stock and they like it. But just like anyone else, they could be wrong. When multiple institutions own a stock, there's always a risk that they are in a 'crowded trade'. When such a trade goes wrong, multiple parties may compete to sell stock fast. This risk is higher in a company without a history of growth. You can see Tudor Gold's historic earnings and revenue below, but keep in mind there's always more to the story.

Tudor Gold is not owned by hedge funds. Tudor Holdings Ltd is currently the largest shareholder, with 22% of shares outstanding. In comparison, the second and third largest shareholders hold about 15% and 3.8% of the stock.
Our studies suggest that the top 15 shareholders collectively control less than half of the company's shares, meaning that the company's shares are widely disseminated and there is no dominant shareholder.
While it makes sense to study institutional ownership data for a company, it also makes sense to study analyst sentiments to know which way the wind is blowing. While there is some analyst coverage, the company is probably not widely covered. So it could gain more attention, down the track.
Insider Ownership Of Tudor Gold
The definition of company insiders can be subjective and does vary between jurisdictions. Our data reflects individual insiders, capturing board members at the very least. Management ultimately answers to the board. However, it is not uncommon for managers to be executive board members, especially if they are a founder or the CEO.
Insider ownership is positive when it signals leadership are thinking like the true owners of the company. However, high insider ownership can also give immense power to a small group within the company. This can be negative in some circumstances.
It seems insiders own a significant proportion of Tudor Gold Corp.. Insiders have a CA$27m stake in this CA$162m business. We would say this shows alignment with shareholders, but it is worth noting that the company is still quite small; some insiders may have founded the business. You can click here to see if those insiders have been buying or selling.
General Public Ownership
The general public, mostly comprising of individual investors, collectively holds 56% of Tudor Gold shares. With this amount of ownership, retail investors can collectively play a role in decisions that affect shareholder returns, such as dividend policies and the appointment of directors. They can also exercise the power to vote on acquisitions or mergers that may not improve profitability.
Private Company Ownership
It seems that Private Companies own 22%, of the Tudor Gold stock. It's hard to draw any conclusions from this fact alone, so its worth looking into who owns those private companies. Sometimes insiders or other related parties have an interest in shares in a public company through a separate private company.
Next Steps:
It's always worth thinking about the different groups who own shares in a company. But to understand Tudor Gold better, we need to consider many other factors. Case in point: We've spotted 3 warning signs for Tudor Gold you should be aware of, and 2 of them shouldn't be ignored.
If you are like me, you may want to think about whether this company will grow or shrink. Luckily, you can check this free report showing analyst forecasts for its future.
NB: Figures in this article are calculated using data from the last twelve months, which refer to the 12-month period ending on the last date of the month the financial statement is dated. This may not be consistent with full year annual report figures.
Have feedback on this article? Concerned about the content? Get in touch with us directly. Alternatively, email editorial-team (at) simplywallst.com.
This article by Simply Wall St is general in nature. We provide commentary based on historical data and analyst forecasts only using an unbiased methodology and our articles are not intended to be financial advice. It does not constitute a recommendation to buy or sell any stock, and does not take account of your objectives, or your financial situation. We aim to bring you long-term focused analysis driven by fundamental data. Note that our analysis may not factor in the latest price-sensitive company announcements or qualitative material. Simply Wall St has no position in any stocks mentioned.