
- PREMIUM
- LIVE QUOTES
- INSTITUTIONS
 Index Options
 State Street
 CME Group
 Nasdaq
 Cboe
Cboe TradingView
 Wall Street Journal
European Dividend Stocks To Watch In July 2025
As European markets remain largely stable, with the pan-European STOXX Europe 600 Index ending roughly flat and mixed performances across major stock indexes, investors are keenly observing developments in U.S. and European trade talks. In this environment of cautious optimism, dividend stocks can offer a potential source of steady income, making them an attractive option for those seeking stability amid economic fluctuations.
Top 10 Dividend Stocks In Europe
| Name | Dividend Yield | Dividend Rating |
| Zurich Insurance Group (SWX:ZURN) | 4.42% | ★★★★★★ |
| Rubis (ENXTPA:RUI) | 7.10% | ★★★★★★ |
| OVB Holding (XTRA:O4B) | 4.76% | ★★★★★★ |
| Julius Bär Gruppe (SWX:BAER) | 4.60% | ★★★★★★ |
| Holcim (SWX:HOLN) | 4.84% | ★★★★★★ |
| HEXPOL (OM:HPOL B) | 4.77% | ★★★★★★ |
| ERG (BIT:ERG) | 5.30% | ★★★★★★ |
| DKSH Holding (SWX:DKSH) | 4.02% | ★★★★★★ |
| Banque Cantonale Vaudoise (SWX:BCVN) | 4.54% | ★★★★★★ |
| Allianz (XTRA:ALV) | 4.48% | ★★★★★★ |
Click here to see the full list of 228 stocks from our Top European Dividend Stocks screener.
We'll examine a selection from our screener results.
IVF Hartmann Holding (SWX:VBSN)
Simply Wall St Dividend Rating: ★★★★★☆
Overview: IVF Hartmann Holding AG supplies medical consumer goods both in Switzerland and internationally, with a market cap of CHF334.58 million.
Operations: IVF Hartmann Holding AG generates revenue through its segments in Wound Care (CHF44.04 million), Infection Management (CHF58.87 million), and Incontinence Management (CHF33.92 million).
Dividend Yield: 4.2%
IVF Hartmann Holding's dividend is attractive with a yield of 4.23%, placing it in the top 25% of Swiss dividend payers. The payout ratio of 37.8% indicates dividends are well covered by earnings, though the cash payout ratio at 82.9% suggests less coverage by free cash flow. Despite past volatility and an unstable track record, dividends have grown over the last decade. Earnings growth was strong at 34% last year, enhancing its appeal as a value option with a P/E ratio below the market average.
- Get an in-depth perspective on IVF Hartmann Holding's performance by reading our dividend report here.
- Our comprehensive valuation report raises the possibility that IVF Hartmann Holding is priced higher than what may be justified by its financials.

Mennica Polska (WSE:MNC)
Simply Wall St Dividend Rating: ★★★★☆☆
Overview: Mennica Polska S.A. is involved in the manufacturing and distribution of minting and engraved/medallist products both in Poland and internationally, with a market cap of PLN1.53 billion.
Operations: Mennica Polska S.A.'s revenue is primarily derived from three segments: Electronic Payments (PLN239.76 million), Money Mint Related Products (PLN1.15 billion), and Real Estate Development Activity (PLN69.90 million).
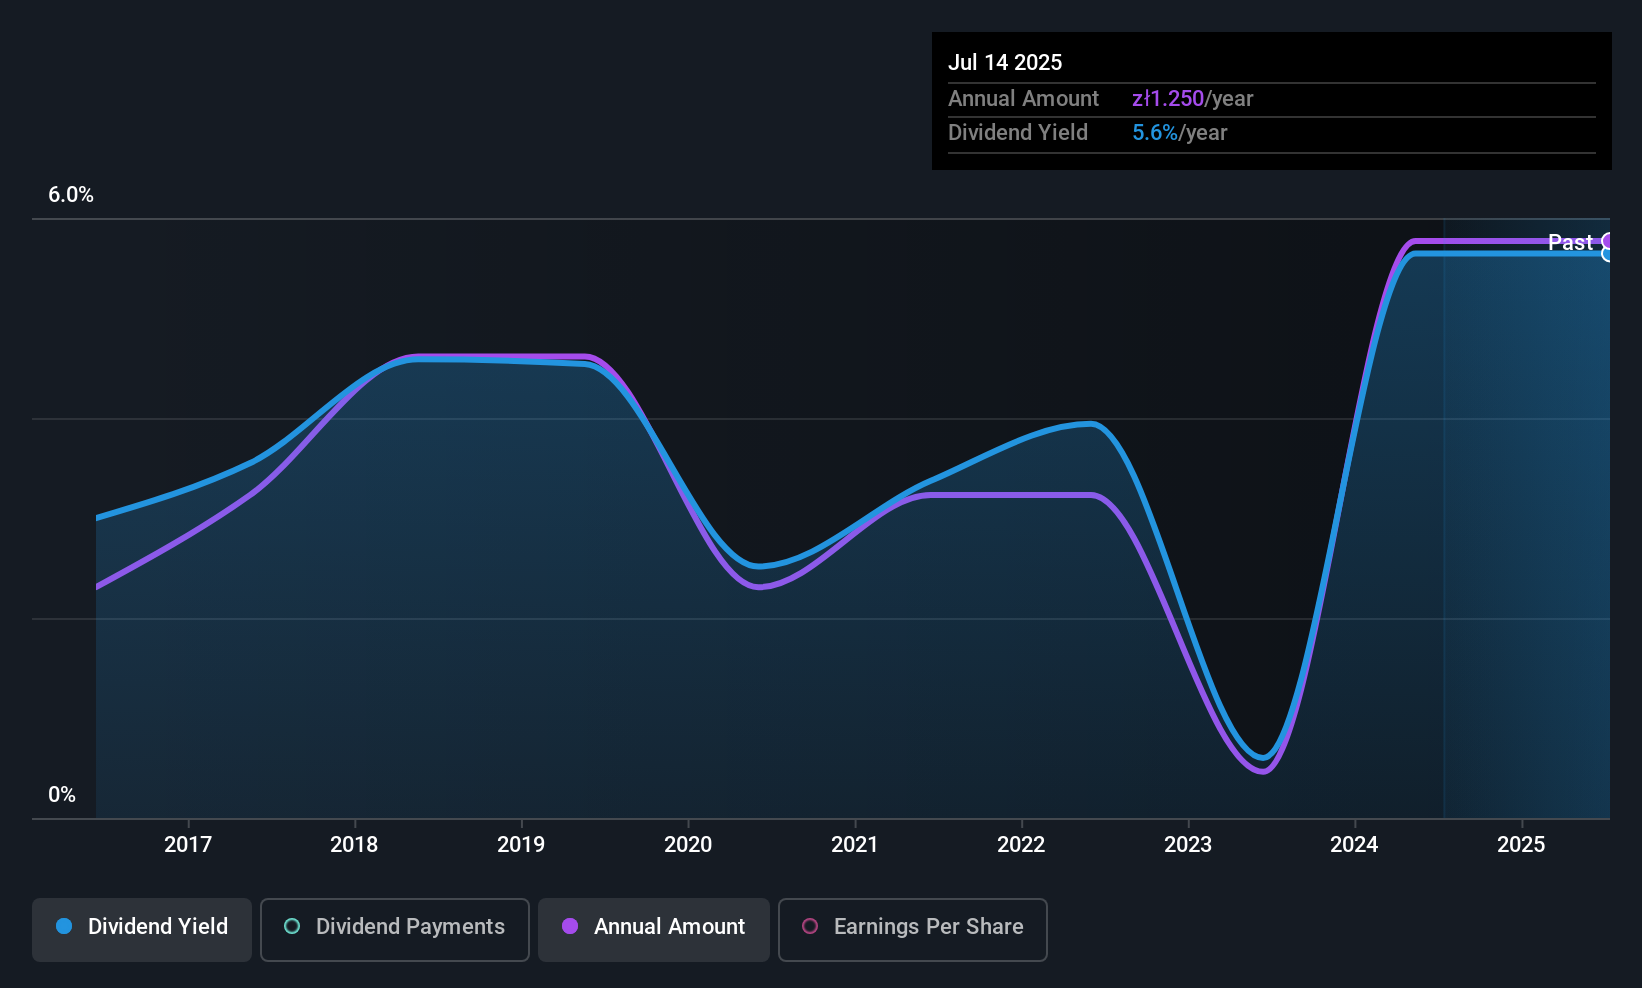
Dividend Yield: 4%
Mennica Polska's dividend yield of 3.99% is below the top tier in Poland, and its dividends have been volatile over the past decade. Despite this, dividends are covered by earnings (59.4% payout ratio) and cash flows (68.2% cash payout ratio). Recent earnings growth, with Q1 net income rising to PLN 39.87 million from PLN 18.84 million year-on-year, supports dividend sustainability despite a recent decrease to PLN 0.50 per share announced for October 2025 payment.
- Delve into the full analysis dividend report here for a deeper understanding of Mennica Polska.
- Upon reviewing our latest valuation report, Mennica Polska's share price might be too optimistic.
Powszechny Zaklad Ubezpieczen (WSE:PZU)
Simply Wall St Dividend Rating: ★★★★★☆
Overview: Powszechny Zaklad Ubezpieczen SA offers life and non-life insurance products and services in Poland, the Baltic States, and Ukraine, with a market cap of PLN53.71 billion.
Operations: Powszechny Zaklad Ubezpieczen SA's revenue is primarily derived from Banking Activities (PLN41.73 billion), Mass Insurance (PLN15.90 billion), Group and Individually Continued Insurance (PLN11.90 billion), Corporate Insurance (PLN5.35 billion), Investments (PLN841 million), Pensions (PLN370 million), Ukraine operations (PLN279 million), Life Investment Insurance (PLN99 million) and Investment Contracts (PLN39 million).
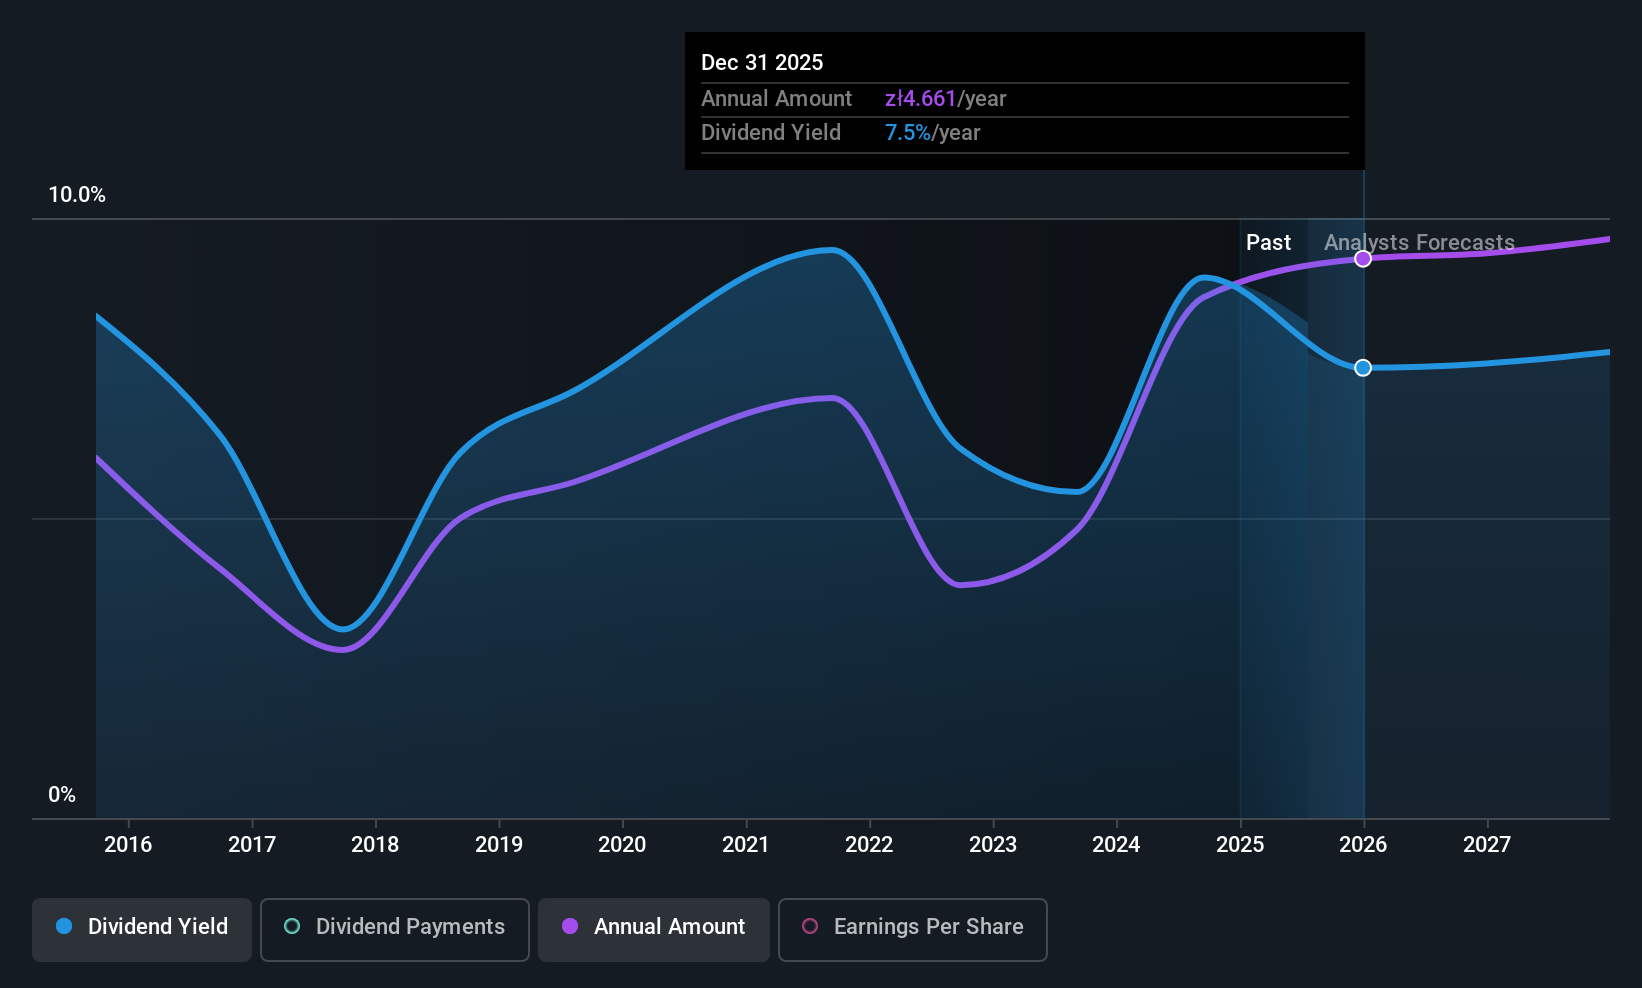
Dividend Yield: 7.2%
Powszechny Zaklad Ubezpieczen's dividend yield is among the top 25% in Poland, with a recent increase to PLN 4.47 per share payable in October 2025. The dividends are well-covered by earnings (66% payout ratio) and cash flows (14.2% cash payout ratio), indicating sustainability. However, the dividend has been volatile over the past decade, raising concerns about reliability despite current financial strength and trading at a significant discount to estimated fair value.
- Click to explore a detailed breakdown of our findings in Powszechny Zaklad Ubezpieczen's dividend report.
- Our expertly prepared valuation report Powszechny Zaklad Ubezpieczen implies its share price may be lower than expected.
Key Takeaways
- Click this link to deep-dive into the 228 companies within our Top European Dividend Stocks screener.
- Got skin in the game with these stocks? Elevate how you manage them by using Simply Wall St's portfolio, where intuitive tools await to help optimize your investment outcomes.
- Discover a world of investment opportunities with Simply Wall St's free app and access unparalleled stock analysis across all markets.
Want To Explore Some Alternatives?
- Explore high-performing small cap companies that haven't yet garnered significant analyst attention.
- Fuel your portfolio with companies showing strong growth potential, backed by optimistic outlooks both from analysts and management.
- Find companies with promising cash flow potential yet trading below their fair value.
This article by Simply Wall St is general in nature. We provide commentary based on historical data and analyst forecasts only using an unbiased methodology and our articles are not intended to be financial advice. It does not constitute a recommendation to buy or sell any stock, and does not take account of your objectives, or your financial situation. We aim to bring you long-term focused analysis driven by fundamental data. Note that our analysis may not factor in the latest price-sensitive company announcements or qualitative material. Simply Wall St has no position in any stocks mentioned.
Have feedback on this article? Concerned about the content? Get in touch with us directly. Alternatively, email editorial-team@simplywallst.com