
- PREMIUM
- LIVE QUOTES
- INSTITUTIONS
 Index Options
 State Street
 CME Group
 Nasdaq
 Cboe
Cboe TradingView
 Wall Street Journal
Asian Market Value Stocks: Accelink Technologies CoLtd And Two More Trading Below Estimated Worth
As global markets navigate the complexities of new U.S. tariffs and mixed economic data, Asian stocks present intriguing opportunities for investors seeking value in a landscape marked by cautious optimism. In this environment, identifying undervalued stocks like Accelink Technologies Co., Ltd., which are trading below their estimated worth, can offer potential for growth as market conditions evolve.
Top 10 Undervalued Stocks Based On Cash Flows In Asia
| Name | Current Price | Fair Value (Est) | Discount (Est) |
| Wenzhou Yihua Connector (SZSE:002897) | CN¥38.39 | CN¥75.06 | 48.9% |
| Range Intelligent Computing Technology Group (SZSE:300442) | CN¥52.97 | CN¥104.19 | 49.2% |
| Ningbo Sanxing Medical ElectricLtd (SHSE:601567) | CN¥23.06 | CN¥46.09 | 50% |
| Nanya Technology (TWSE:2408) | NT$41.75 | NT$82.05 | 49.1% |
| Medy-Tox (KOSDAQ:A086900) | ₩161300.00 | ₩322233.66 | 49.9% |
| Maxscend Microelectronics (SZSE:300782) | CN¥70.97 | CN¥138.00 | 48.6% |
| Hugel (KOSDAQ:A145020) | ₩357500.00 | ₩698441.84 | 48.8% |
| HL Holdings (KOSE:A060980) | ₩42300.00 | ₩82760.82 | 48.9% |
| cottaLTD (TSE:3359) | ¥428.00 | ¥854.19 | 49.9% |
| ALUX (KOSDAQ:A475580) | ₩11460.00 | ₩22618.64 | 49.3% |
Here we highlight a subset of our preferred stocks from the screener.
Accelink Technologies CoLtd (SZSE:002281)
Overview: Accelink Technologies Co., Ltd. is engaged in the research, development, manufacturing, sales, and provision of technical services for optoelectronic chips, devices, modules, and subsystem products primarily in China with a market cap of CN¥39.33 billion.
Operations: Accelink Technologies Co., Ltd. generates revenue of CN¥9.16 billion from its communication equipment manufacturing segment.
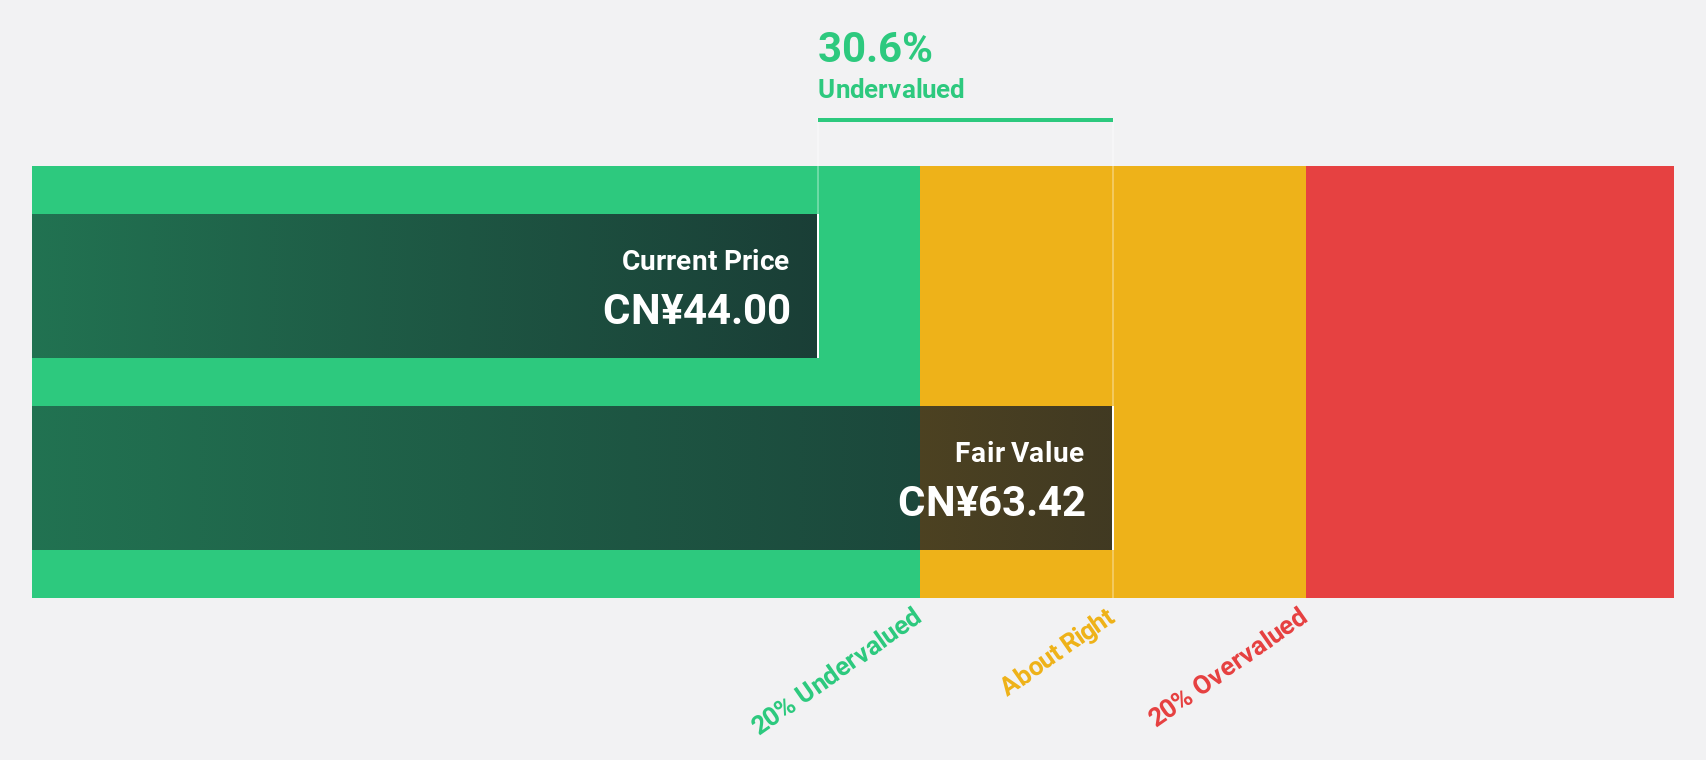
Estimated Discount To Fair Value: 29.6%
Accelink Technologies Co., Ltd. appears undervalued, trading 29.6% below its estimated fair value of CNY 69.28, with a current price of CNY 48.75. Despite a low dividend coverage by free cash flows and forecasted low return on equity, the company shows strong growth potential with earnings expected to grow significantly at 28% annually over the next three years, outpacing the Chinese market's average growth rate of 23.3%.
- Our growth report here indicates Accelink Technologies CoLtd may be poised for an improving outlook.
- Take a closer look at Accelink Technologies CoLtd's balance sheet health here in our report.
Auras Technology (TPEX:3324)
Overview: Auras Technology Co., Ltd. is involved in the manufacturing, processing, and retailing of electronic materials and computer cooling modules across multiple international markets, with a market cap of NT$62.65 billion.
Operations: The company's revenue primarily comes from its Electronic Components & Parts segment, generating NT$17.04 billion.
Estimated Discount To Fair Value: 24.1%
Auras Technology is trading at NT$694, significantly below its estimated fair value of NT$914.39, suggesting undervaluation. The company reported strong earnings growth for Q1 2025, with sales rising to TWD 4.42 billion from TWD 3.15 billion the previous year and net income increasing to TWD 511.13 million from TWD 395.61 million. Earnings are forecasted to grow at a robust rate of 24.9% annually over the next three years, surpassing market averages in Taiwan.
- Our expertly prepared growth report on Auras Technology implies its future financial outlook may be stronger than recent results.
- Get an in-depth perspective on Auras Technology's balance sheet by reading our health report here.

COVER (TSE:5253)
Overview: COVER Corporation operates in the virtual platform, VTuber production, and media mix sectors with a market cap of ¥143.58 billion.
Operations: COVER Corporation's revenue is derived from its virtual platform, VTuber production, and media mix businesses.
Estimated Discount To Fair Value: 37.2%
COVER Corporation is trading at ¥2,187, considerably below its fair value estimate of ¥3,482.61. The company’s earnings are projected to grow significantly at 20.5% annually over the next three years, outpacing the Japanese market average of 7.7%. Despite recent share price volatility and high non-cash earnings levels, COVER's revenue is expected to rise by 15.1% per year, indicating strong growth prospects relative to market trends.
- Upon reviewing our latest growth report, COVER's projected financial performance appears quite optimistic.
- Click here to discover the nuances of COVER with our detailed financial health report.

Taking Advantage
- Explore the 266 names from our Undervalued Asian Stocks Based On Cash Flows screener here.
- Already own these companies? Bring clarity to your investment decisions by linking up your portfolio with Simply Wall St, where you can monitor all the vital signs of your stocks effortlessly.
- Elevate your portfolio with Simply Wall St, the ultimate app for investors seeking global market coverage.
Ready To Venture Into Other Investment Styles?
- Explore high-performing small cap companies that haven't yet garnered significant analyst attention.
- Diversify your portfolio with solid dividend payers offering reliable income streams to weather potential market turbulence.
- Fuel your portfolio with companies showing strong growth potential, backed by optimistic outlooks both from analysts and management.
This article by Simply Wall St is general in nature. We provide commentary based on historical data and analyst forecasts only using an unbiased methodology and our articles are not intended to be financial advice. It does not constitute a recommendation to buy or sell any stock, and does not take account of your objectives, or your financial situation. We aim to bring you long-term focused analysis driven by fundamental data. Note that our analysis may not factor in the latest price-sensitive company announcements or qualitative material. Simply Wall St has no position in any stocks mentioned.
Have feedback on this article? Concerned about the content? Get in touch with us directly. Alternatively, email editorial-team@simplywallst.com