
- PREMIUM
- LIVE QUOTES
- INSTITUTIONS
 Index Options
 State Street
 CME Group
 Nasdaq
 Cboe
Cboe TradingView
 Wall Street Journal
Is Tata Chemicals Limited (NSE:TATACHEM) Worth ₹925 Based On Its Intrinsic Value?
Key Insights
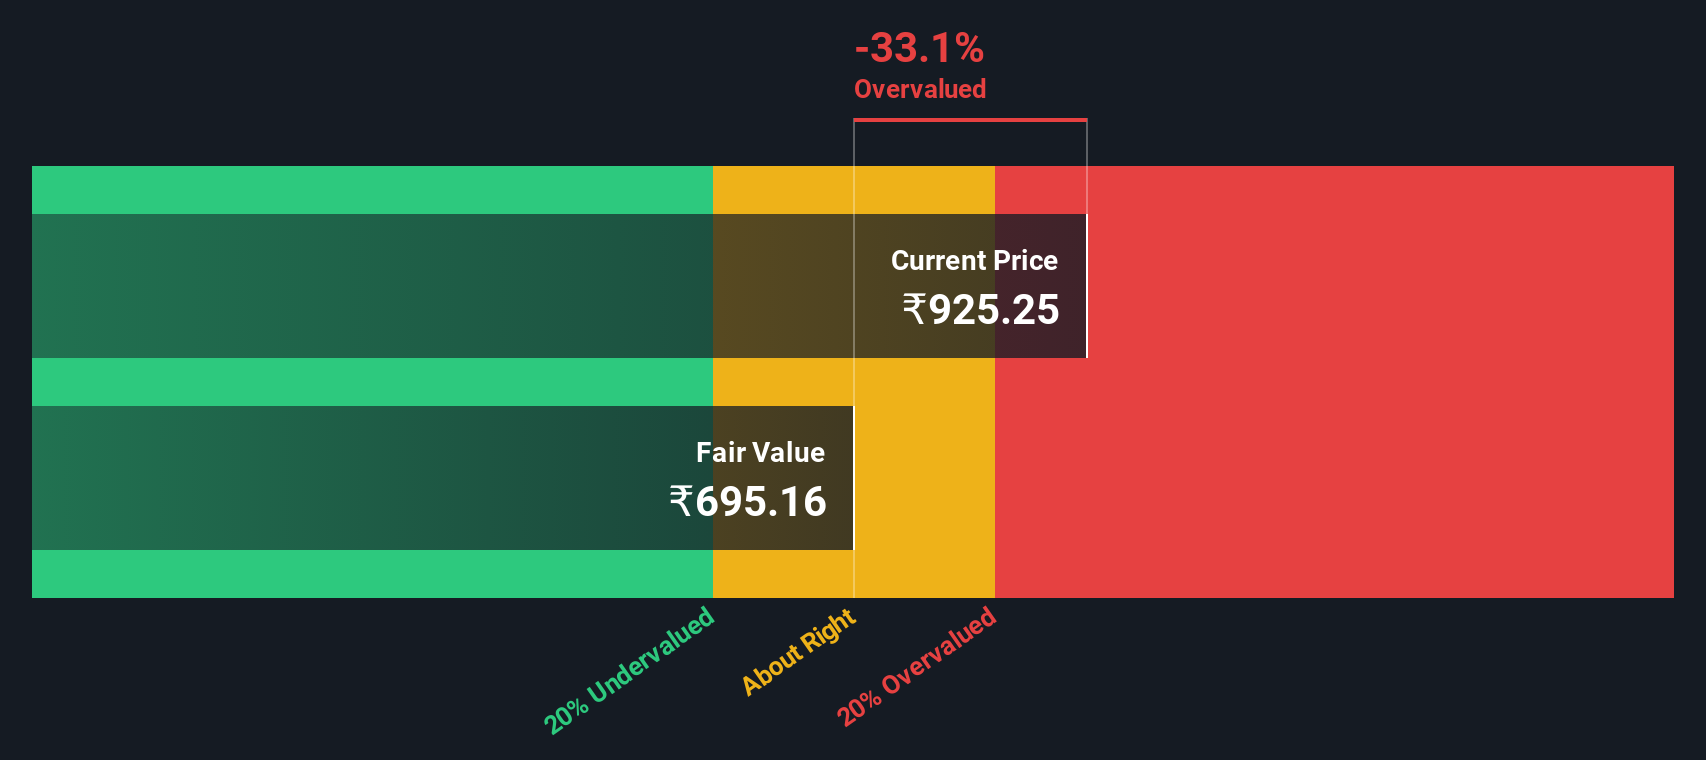
- The projected fair value for Tata Chemicals is ₹695 based on 2 Stage Free Cash Flow to Equity
- Tata Chemicals is estimated to be 33% overvalued based on current share price of ₹925
- Our fair value estimate is 15% lower than Tata Chemicals' analyst price target of ₹814
Today we'll do a simple run through of a valuation method used to estimate the attractiveness of Tata Chemicals Limited (NSE:TATACHEM) as an investment opportunity by projecting its future cash flows and then discounting them to today's value. Our analysis will employ the Discounted Cash Flow (DCF) model. Models like these may appear beyond the comprehension of a lay person, but they're fairly easy to follow.
Remember though, that there are many ways to estimate a company's value, and a DCF is just one method. Anyone interested in learning a bit more about intrinsic value should have a read of the Simply Wall St analysis model.
The Calculation
We're using the 2-stage growth model, which simply means we take in account two stages of company's growth. In the initial period the company may have a higher growth rate and the second stage is usually assumed to have a stable growth rate. In the first stage we need to estimate the cash flows to the business over the next ten years. Where possible we use analyst estimates, but when these aren't available we extrapolate the previous free cash flow (FCF) from the last estimate or reported value. We assume companies with shrinking free cash flow will slow their rate of shrinkage, and that companies with growing free cash flow will see their growth rate slow, over this period. We do this to reflect that growth tends to slow more in the early years than it does in later years.
Generally we assume that a dollar today is more valuable than a dollar in the future, so we need to discount the sum of these future cash flows to arrive at a present value estimate:
10-year free cash flow (FCF) forecast
| 2026 | 2027 | 2028 | 2029 | 2030 | 2031 | 2032 | 2033 | 2034 | 2035 | |
| Levered FCF (₹, Millions) | ₹8.68b | ₹13.1b | ₹14.5b | ₹15.8b | ₹17.2b | ₹18.6b | ₹20.0b | ₹21.5b | ₹23.0b | ₹24.6b |
| Growth Rate Estimate Source | Analyst x1 | Analyst x1 | Est @ 10.37% | Est @ 9.28% | Est @ 8.52% | Est @ 7.98% | Est @ 7.61% | Est @ 7.35% | Est @ 7.17% | Est @ 7.04% |
| Present Value (₹, Millions) Discounted @ 14% | ₹7.6k | ₹10.1k | ₹9.7k | ₹9.3k | ₹8.9k | ₹8.4k | ₹7.9k | ₹7.4k | ₹7.0k | ₹6.5k |
("Est" = FCF growth rate estimated by Simply Wall St)
Present Value of 10-year Cash Flow (PVCF) = ₹83b
We now need to calculate the Terminal Value, which accounts for all the future cash flows after this ten year period. The Gordon Growth formula is used to calculate Terminal Value at a future annual growth rate equal to the 5-year average of the 10-year government bond yield of 6.7%. We discount the terminal cash flows to today's value at a cost of equity of 14%.
Terminal Value (TV)= FCF2035 × (1 + g) ÷ (r – g) = ₹25b× (1 + 6.7%) ÷ (14%– 6.7%) = ₹354b
Present Value of Terminal Value (PVTV)= TV / (1 + r)10= ₹354b÷ ( 1 + 14%)10= ₹94b
The total value is the sum of cash flows for the next ten years plus the discounted terminal value, which results in the Total Equity Value, which in this case is ₹177b. To get the intrinsic value per share, we divide this by the total number of shares outstanding. Compared to the current share price of ₹925, the company appears potentially overvalued at the time of writing. Valuations are imprecise instruments though, rather like a telescope - move a few degrees and end up in a different galaxy. Do keep this in mind.
Important Assumptions
The calculation above is very dependent on two assumptions. The first is the discount rate and the other is the cash flows. If you don't agree with these result, have a go at the calculation yourself and play with the assumptions. The DCF also does not consider the possible cyclicality of an industry, or a company's future capital requirements, so it does not give a full picture of a company's potential performance. Given that we are looking at Tata Chemicals as potential shareholders, the cost of equity is used as the discount rate, rather than the cost of capital (or weighted average cost of capital, WACC) which accounts for debt. In this calculation we've used 14%, which is based on a levered beta of 1.022. Beta is a measure of a stock's volatility, compared to the market as a whole. We get our beta from the industry average beta of globally comparable companies, with an imposed limit between 0.8 and 2.0, which is a reasonable range for a stable business.
View our latest analysis for Tata Chemicals
SWOT Analysis for Tata Chemicals
- Debt is well covered by cash flow.
- Earnings declined over the past year.
- Interest payments on debt are not well covered.
- Dividend is low compared to the top 25% of dividend payers in the Chemicals market.
- Expensive based on P/E ratio and estimated fair value.
- Annual earnings are forecast to grow faster than the Indian market.
- Dividends are not covered by earnings.
- Annual revenue is forecast to grow slower than the Indian market.
Moving On:
Although the valuation of a company is important, it ideally won't be the sole piece of analysis you scrutinize for a company. The DCF model is not a perfect stock valuation tool. Preferably you'd apply different cases and assumptions and see how they would impact the company's valuation. For example, changes in the company's cost of equity or the risk free rate can significantly impact the valuation. What is the reason for the share price exceeding the intrinsic value? For Tata Chemicals, there are three fundamental items you should explore:
- Risks: For example, we've discovered 1 warning sign for Tata Chemicals that you should be aware of before investing here.
- Future Earnings: How does TATACHEM's growth rate compare to its peers and the wider market? Dig deeper into the analyst consensus number for the upcoming years by interacting with our free analyst growth expectation chart.
- Other Solid Businesses: Low debt, high returns on equity and good past performance are fundamental to a strong business. Why not explore our interactive list of stocks with solid business fundamentals to see if there are other companies you may not have considered!
PS. The Simply Wall St app conducts a discounted cash flow valuation for every stock on the NSEI every day. If you want to find the calculation for other stocks just search here.
Have feedback on this article? Concerned about the content? Get in touch with us directly. Alternatively, email editorial-team (at) simplywallst.com.
This article by Simply Wall St is general in nature. We provide commentary based on historical data and analyst forecasts only using an unbiased methodology and our articles are not intended to be financial advice. It does not constitute a recommendation to buy or sell any stock, and does not take account of your objectives, or your financial situation. We aim to bring you long-term focused analysis driven by fundamental data. Note that our analysis may not factor in the latest price-sensitive company announcements or qualitative material. Simply Wall St has no position in any stocks mentioned.