
- PREMIUM
- LIVE QUOTES
- INSTITUTIONS
 Index Options
 State Street
 CME Group
 Nasdaq
 Cboe
Cboe TradingView
 Wall Street Journal
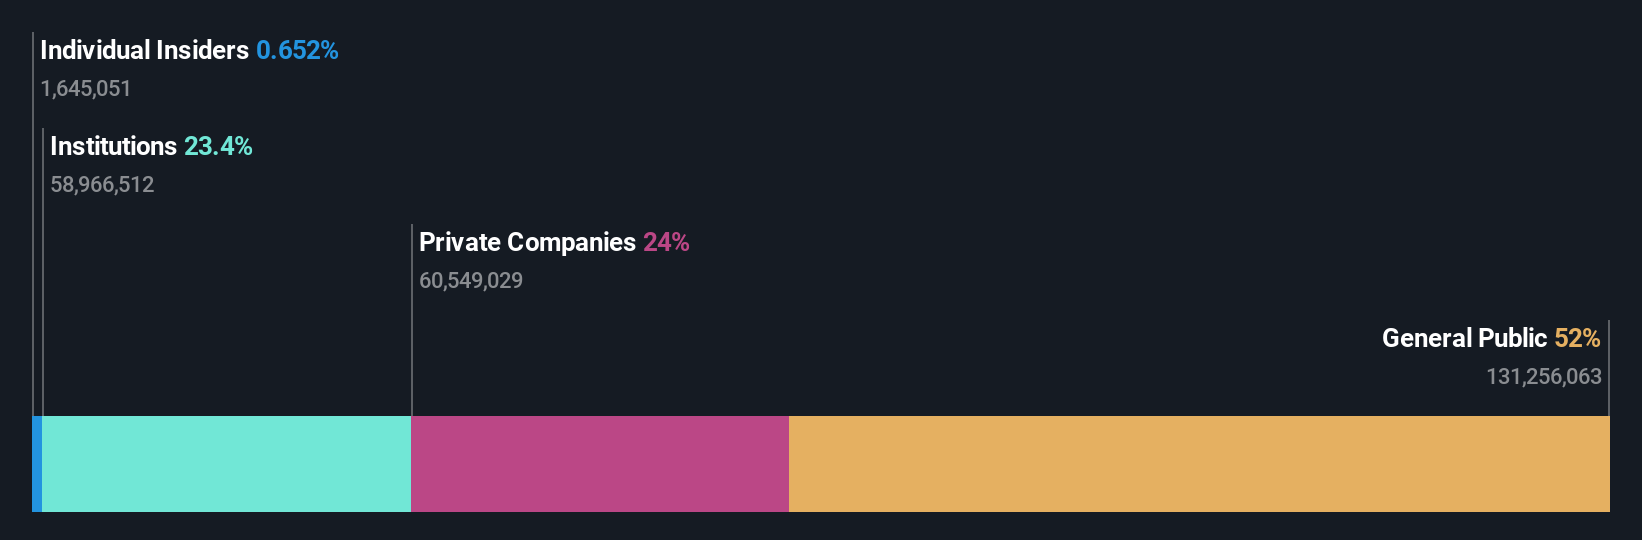
While private companies own 24% of Glanbia plc (ISE:GL9), retail investors are its largest shareholders with 52% ownership
Key Insights
- The considerable ownership by retail investors in Glanbia indicates that they collectively have a greater say in management and business strategy
- The top 25 shareholders own 45% of the company
- Institutions own 23% of Glanbia
If you want to know who really controls Glanbia plc (ISE:GL9), then you'll have to look at the makeup of its share registry. And the group that holds the biggest piece of the pie are retail investors with 52% ownership. In other words, the group stands to gain the most (or lose the most) from their investment into the company.
Meanwhile, private companies make up 24% of the company’s shareholders.
Let's delve deeper into each type of owner of Glanbia, beginning with the chart below.
View our latest analysis for Glanbia
What Does The Institutional Ownership Tell Us About Glanbia?
Many institutions measure their performance against an index that approximates the local market. So they usually pay more attention to companies that are included in major indices.
Glanbia already has institutions on the share registry. Indeed, they own a respectable stake in the company. This can indicate that the company has a certain degree of credibility in the investment community. However, it is best to be wary of relying on the supposed validation that comes with institutional investors. They too, get it wrong sometimes. It is not uncommon to see a big share price drop if two large institutional investors try to sell out of a stock at the same time. So it is worth checking the past earnings trajectory of Glanbia, (below). Of course, keep in mind that there are other factors to consider, too.

Glanbia is not owned by hedge funds. The company's largest shareholder is Glanbia Co-operative Society Limited, with ownership of 24%. In comparison, the second and third largest shareholders hold about 4.3% and 3.1% of the stock.
A deeper look at our ownership data shows that the top 25 shareholders collectively hold less than half of the register, suggesting a large group of small holders where no single shareholder has a majority.
While studying institutional ownership for a company can add value to your research, it is also a good practice to research analyst recommendations to get a deeper understand of a stock's expected performance. There are plenty of analysts covering the stock, so it might be worth seeing what they are forecasting, too.
Insider Ownership Of Glanbia
While the precise definition of an insider can be subjective, almost everyone considers board members to be insiders. Management ultimately answers to the board. However, it is not uncommon for managers to be executive board members, especially if they are a founder or the CEO.
Most consider insider ownership a positive because it can indicate the board is well aligned with other shareholders. However, on some occasions too much power is concentrated within this group.
Our most recent data indicates that insiders own less than 1% of Glanbia plc. However, it's possible that insiders might have an indirect interest through a more complex structure. Keep in mind that it's a big company, and the insiders own €21m worth of shares. The absolute value might be more important than the proportional share. Arguably, recent buying and selling is just as important to consider. You can click here to see if insiders have been buying or selling.
General Public Ownership
The general public, who are usually individual investors, hold a substantial 52% stake in Glanbia, suggesting it is a fairly popular stock. With this amount of ownership, retail investors can collectively play a role in decisions that affect shareholder returns, such as dividend policies and the appointment of directors. They can also exercise the power to vote on acquisitions or mergers that may not improve profitability.
Private Company Ownership
It seems that Private Companies own 24%, of the Glanbia stock. It's hard to draw any conclusions from this fact alone, so its worth looking into who owns those private companies. Sometimes insiders or other related parties have an interest in shares in a public company through a separate private company.
Next Steps:
It's always worth thinking about the different groups who own shares in a company. But to understand Glanbia better, we need to consider many other factors. For example, we've discovered 4 warning signs for Glanbia that you should be aware of before investing here.
If you would prefer discover what analysts are predicting in terms of future growth, do not miss this free report on analyst forecasts.
NB: Figures in this article are calculated using data from the last twelve months, which refer to the 12-month period ending on the last date of the month the financial statement is dated. This may not be consistent with full year annual report figures.
Have feedback on this article? Concerned about the content? Get in touch with us directly. Alternatively, email editorial-team (at) simplywallst.com.
This article by Simply Wall St is general in nature. We provide commentary based on historical data and analyst forecasts only using an unbiased methodology and our articles are not intended to be financial advice. It does not constitute a recommendation to buy or sell any stock, and does not take account of your objectives, or your financial situation. We aim to bring you long-term focused analysis driven by fundamental data. Note that our analysis may not factor in the latest price-sensitive company announcements or qualitative material. Simply Wall St has no position in any stocks mentioned.