
- PREMIUM
- LIVE QUOTES
- INSTITUTIONS
 Index Options
 State Street
 CME Group
 Nasdaq
 Cboe
Cboe TradingView
 Wall Street Journal
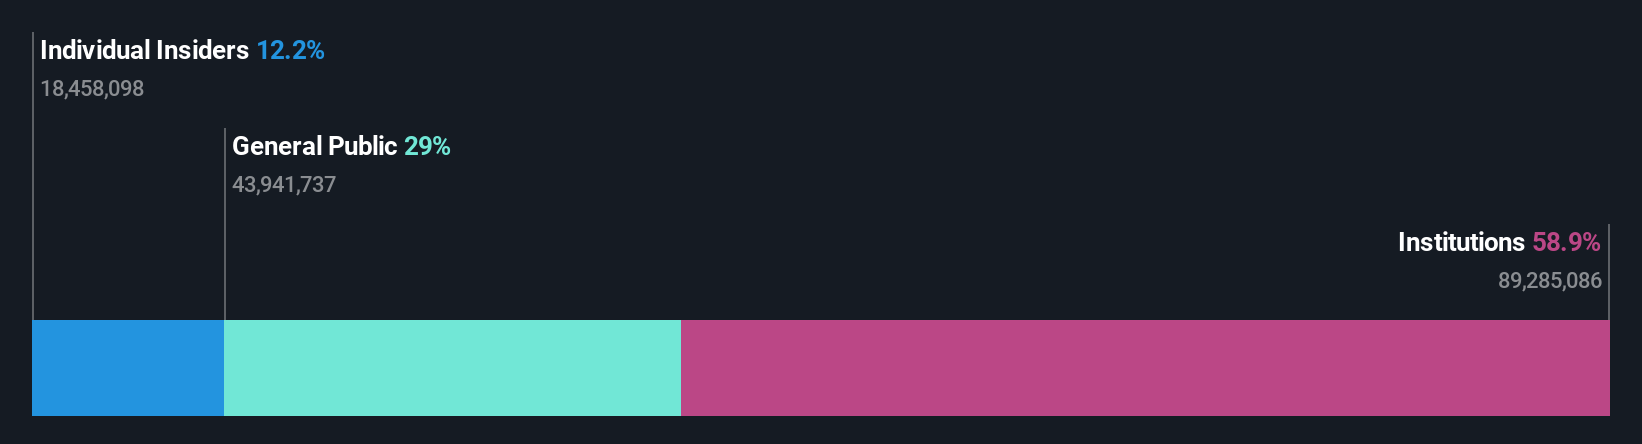
Baycurrent, Inc. (TSE:6532) is a favorite amongst institutional investors who own 59%
Key Insights
- Given the large stake in the stock by institutions, Baycurrent's stock price might be vulnerable to their trading decisions
- The top 10 shareholders own 51% of the company
- Insider ownership in Baycurrent is 12%
If you want to know who really controls Baycurrent, Inc. (TSE:6532), then you'll have to look at the makeup of its share registry. We can see that institutions own the lion's share in the company with 59% ownership. In other words, the group stands to gain the most (or lose the most) from their investment into the company.
Because institutional owners have a huge pool of resources and liquidity, their investing decisions tend to carry a great deal of weight, especially with individual investors. Hence, having a considerable amount of institutional money invested in a company is often regarded as a desirable trait.
Let's delve deeper into each type of owner of Baycurrent, beginning with the chart below.
See our latest analysis for Baycurrent
What Does The Institutional Ownership Tell Us About Baycurrent?
Institutions typically measure themselves against a benchmark when reporting to their own investors, so they often become more enthusiastic about a stock once it's included in a major index. We would expect most companies to have some institutions on the register, especially if they are growing.
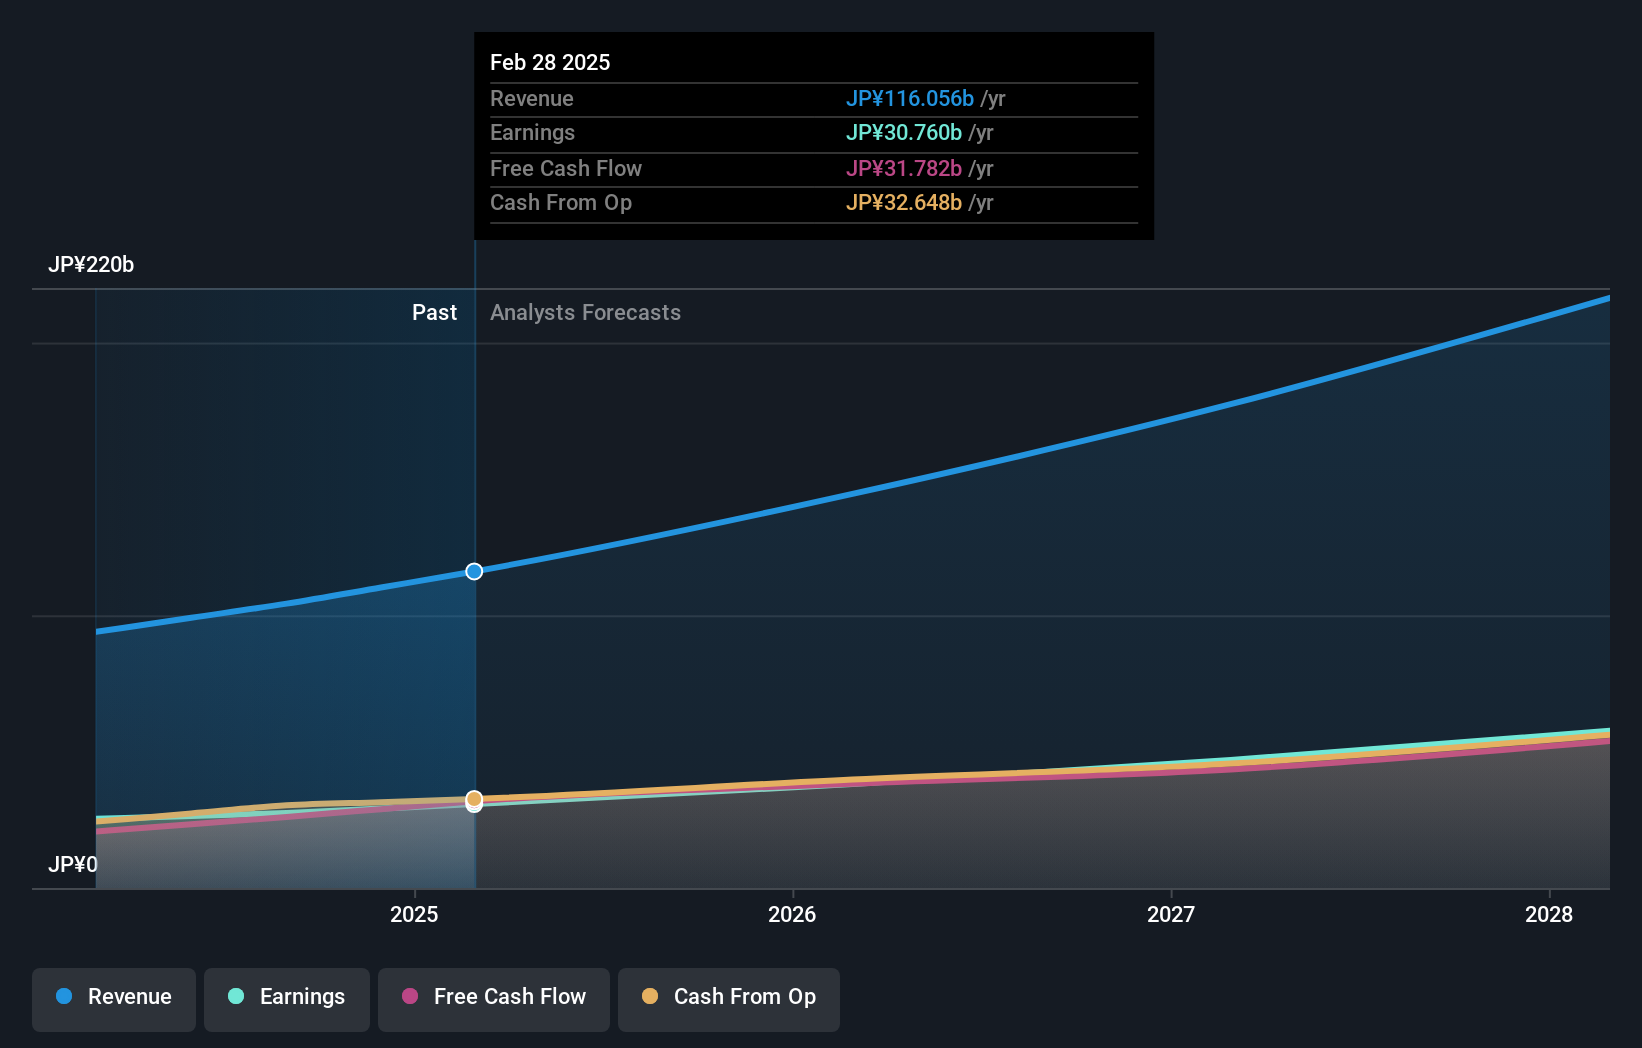
We can see that Baycurrent does have institutional investors; and they hold a good portion of the company's stock. This can indicate that the company has a certain degree of credibility in the investment community. However, it is best to be wary of relying on the supposed validation that comes with institutional investors. They too, get it wrong sometimes. It is not uncommon to see a big share price drop if two large institutional investors try to sell out of a stock at the same time. So it is worth checking the past earnings trajectory of Baycurrent, (below). Of course, keep in mind that there are other factors to consider, too.
Investors should note that institutions actually own more than half the company, so they can collectively wield significant power. We note that hedge funds don't have a meaningful investment in Baycurrent. Our data shows that Arata Eguchi is the largest shareholder with 9.3% of shares outstanding. FMR LLC is the second largest shareholder owning 7.6% of common stock, and Nomura Asset Management Co., Ltd. holds about 6.4% of the company stock.
We did some more digging and found that 10 of the top shareholders account for roughly 51% of the register, implying that along with larger shareholders, there are a few smaller shareholders, thereby balancing out each others interests somewhat.
While it makes sense to study institutional ownership data for a company, it also makes sense to study analyst sentiments to know which way the wind is blowing. Quite a few analysts cover the stock, so you could look into forecast growth quite easily.
Insider Ownership Of Baycurrent
The definition of an insider can differ slightly between different countries, but members of the board of directors always count. The company management answer to the board and the latter should represent the interests of shareholders. Notably, sometimes top-level managers are on the board themselves.
Most consider insider ownership a positive because it can indicate the board is well aligned with other shareholders. However, on some occasions too much power is concentrated within this group.
Our information suggests that insiders maintain a significant holding in Baycurrent, Inc.. It is very interesting to see that insiders have a meaningful JP¥134b stake in this JP¥1.1t business. Most would say this shows a good degree of alignment with shareholders, especially in a company of this size. You can click here to see if those insiders have been buying or selling.
General Public Ownership
With a 29% ownership, the general public, mostly comprising of individual investors, have some degree of sway over Baycurrent. While this group can't necessarily call the shots, it can certainly have a real influence on how the company is run.
Next Steps:
It's always worth thinking about the different groups who own shares in a company. But to understand Baycurrent better, we need to consider many other factors. For instance, we've identified 1 warning sign for Baycurrent that you should be aware of.
If you are like me, you may want to think about whether this company will grow or shrink. Luckily, you can check this free report showing analyst forecasts for its future.
NB: Figures in this article are calculated using data from the last twelve months, which refer to the 12-month period ending on the last date of the month the financial statement is dated. This may not be consistent with full year annual report figures.
Have feedback on this article? Concerned about the content? Get in touch with us directly. Alternatively, email editorial-team (at) simplywallst.com.
This article by Simply Wall St is general in nature. We provide commentary based on historical data and analyst forecasts only using an unbiased methodology and our articles are not intended to be financial advice. It does not constitute a recommendation to buy or sell any stock, and does not take account of your objectives, or your financial situation. We aim to bring you long-term focused analysis driven by fundamental data. Note that our analysis may not factor in the latest price-sensitive company announcements or qualitative material. Simply Wall St has no position in any stocks mentioned.