
- PREMIUM
- LIVE QUOTES
- INSTITUTIONS
 Index Options
 State Street
 CME Group
 Nasdaq
 Cboe
Cboe TradingView
 Wall Street Journal
3 European Stocks That May Be Undervalued In July 2025
As the European markets show signs of resilience, with the STOXX Europe 600 Index climbing 1.32% amid easing geopolitical tensions and promises of economic stimulus, investors are keenly assessing opportunities in the region. Identifying undervalued stocks can be particularly appealing in such an environment, as these equities may offer potential for growth when market conditions stabilize further.
Top 10 Undervalued Stocks Based On Cash Flows In Europe
| Name | Current Price | Fair Value (Est) | Discount (Est) |
| Zaptec (OB:ZAP) | NOK22.50 | NOK44.90 | 49.9% |
| Qt Group Oyj (HLSE:QTCOM) | €57.55 | €113.35 | 49.2% |
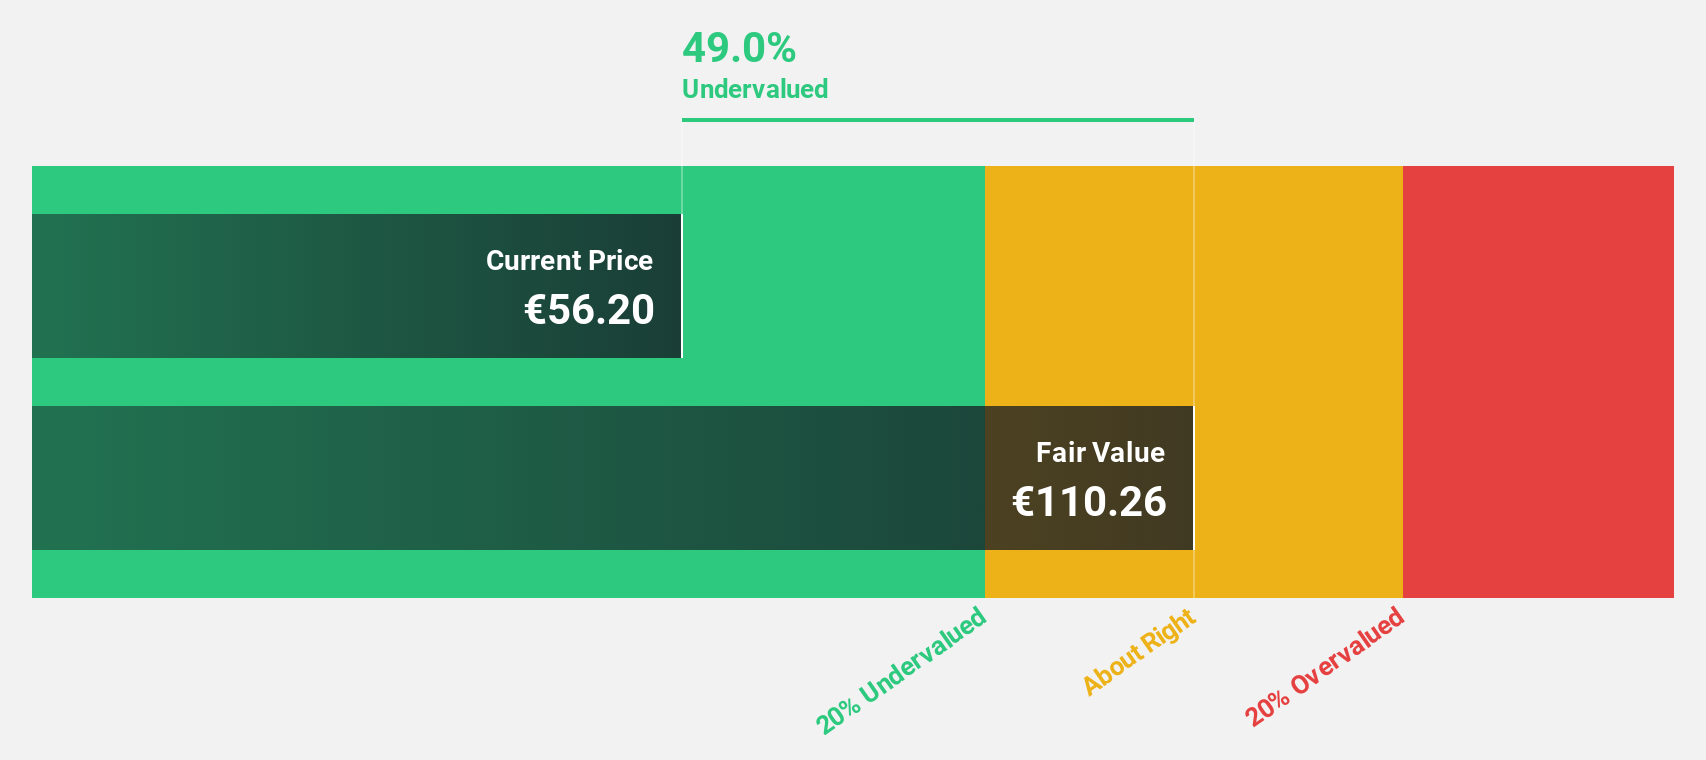
| Laboratorios Farmaceuticos Rovi (BME:ROVI) | €55.75 | €110.26 | 49.4% |
| Ion Beam Applications (ENXTBR:IBAB) | €11.66 | €22.99 | 49.3% |
| innoscripta (XTRA:1INN) | €99.30 | €196.58 | 49.5% |
| Honkarakenne Oyj (HLSE:HONBS) | €2.70 | €5.37 | 49.7% |
| Green Oleo (BIT:GRN) | €0.795 | €1.57 | 49.2% |
| Cavotec (OM:CCC) | SEK17.00 | SEK33.97 | 49.9% |
| Archicom (WSE:ARH) | PLN43.00 | PLN84.73 | 49.2% |
| ABO Energy GmbH KGaA (XTRA:AB9) | €38.40 | €76.54 | 49.8% |
Underneath we present a selection of stocks filtered out by our screen.
Laboratorios Farmaceuticos Rovi (BME:ROVI)
Overview: Laboratorios Farmaceuticos Rovi, S.A. is a pharmaceutical company that manufactures, sells, and markets its products across Spain, the European Union, OECD countries, and internationally with a market cap of €2.85 billion.
Operations: Laboratorios Farmaceuticos Rovi generates revenue through the manufacturing, selling, and marketing of pharmaceutical products across Spain, the European Union, OECD countries, and internationally.
Estimated Discount To Fair Value: 49.4%
Laboratorios Farmaceuticos Rovi is trading at €55.75, significantly below its estimated fair value of €110.26, indicating it may be undervalued based on cash flows. Analysts agree the stock price could rise by 41.8%. With earnings forecast to grow 16.5% annually—outpacing the Spanish market's 5.5%—and revenue projected to increase at 8.2%, Rovi's financial outlook remains robust despite slower-than-significant growth expectations in both earnings and revenue metrics.
- Insights from our recent growth report point to a promising forecast for Laboratorios Farmaceuticos Rovi's business outlook.
- Click here and access our complete balance sheet health report to understand the dynamics of Laboratorios Farmaceuticos Rovi.
Neste Oyj (HLSE:NESTE)
Overview: Neste Oyj, with a market cap of €9.22 billion, operates in the production and distribution of renewable diesel and sustainable aviation fuel across Finland, other Nordic countries, the Baltic Rim, Europe, the United States, and internationally.
Operations: The company's revenue segments include Oil Products (€12.10 billion), Renewable Products (€7.30 billion), and Marketing & Services (€4.51 billion).
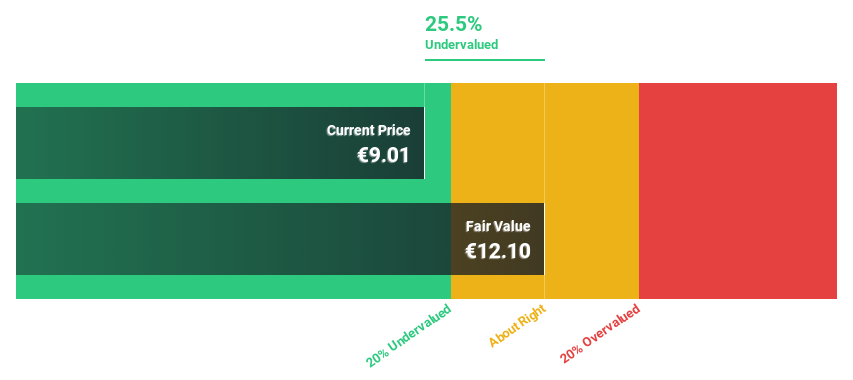
Estimated Discount To Fair Value: 19.6%
Neste Oyj is trading at €12, below its estimated fair value of €14.92, reflecting a modest undervaluation based on discounted cash flow analysis. Despite recent volatility and high debt levels, the company is expected to achieve profitability within three years with earnings projected to grow significantly annually. Recent developments in renewable fuel technology with Chevron Lummus Global highlight potential future revenue streams, although recent index exclusion may impact investor sentiment.
- According our earnings growth report, there's an indication that Neste Oyj might be ready to expand.
- Click here to discover the nuances of Neste Oyj with our detailed financial health report.
Andritz (WBAG:ANDR)
Overview: Andritz AG is a global provider of industrial machinery, equipment, and services across various continents including Europe, North America, South America, China, Asia, Africa, and Australia with a market cap of €5.99 billion.
Operations: The company generates revenue from four main segments: Metals (€1.78 billion), Hydro Power (€1.61 billion), Pulp & Paper (€3.27 billion), and Environment & Energy (€1.52 billion).
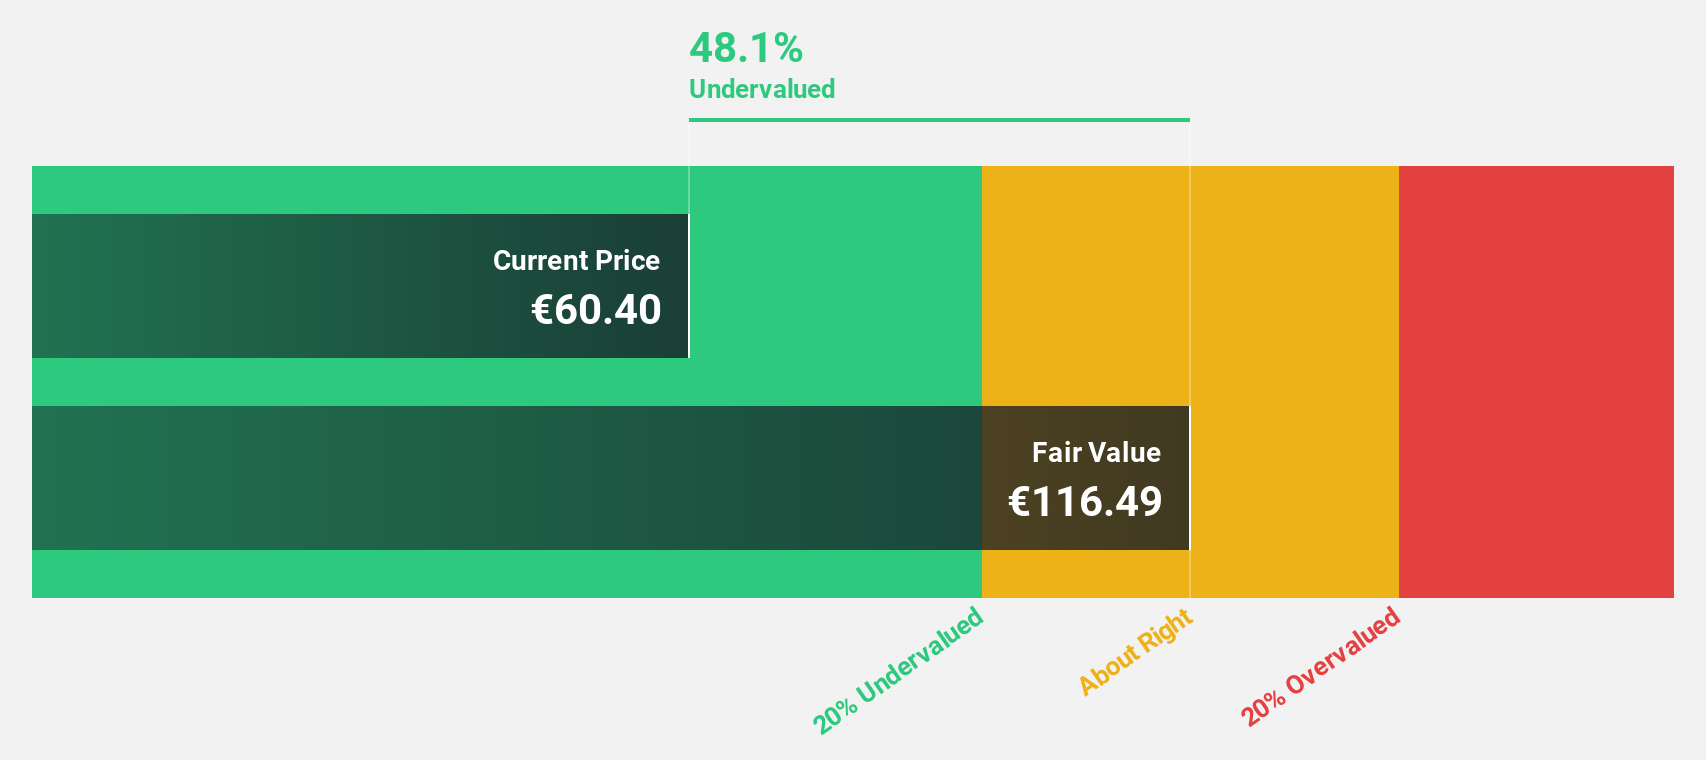
Estimated Discount To Fair Value: 48.3%
Andritz AG, trading at €61.5, is significantly undervalued with an estimated fair value of €118.95 based on discounted cash flow analysis. Despite a decline in first-quarter sales and net income compared to the previous year, earnings are projected to grow 11.47% annually, outpacing the Austrian market's growth rate. However, its dividend yield of 4.23% is not fully supported by free cash flows, indicating potential sustainability concerns despite strong relative value against industry peers.
- Our comprehensive growth report raises the possibility that Andritz is poised for substantial financial growth.
- Unlock comprehensive insights into our analysis of Andritz stock in this financial health report.
Summing It All Up
- Investigate our full lineup of 180 Undervalued European Stocks Based On Cash Flows right here.
- Invested in any of these stocks? Simplify your portfolio management with Simply Wall St and stay ahead with our alerts for any critical updates on your stocks.
- Invest smarter with the free Simply Wall St app providing detailed insights into every stock market around the globe.
Want To Explore Some Alternatives?
- Explore high-performing small cap companies that haven't yet garnered significant analyst attention.
- Diversify your portfolio with solid dividend payers offering reliable income streams to weather potential market turbulence.
- Fuel your portfolio with companies showing strong growth potential, backed by optimistic outlooks both from analysts and management.
This article by Simply Wall St is general in nature. We provide commentary based on historical data and analyst forecasts only using an unbiased methodology and our articles are not intended to be financial advice. It does not constitute a recommendation to buy or sell any stock, and does not take account of your objectives, or your financial situation. We aim to bring you long-term focused analysis driven by fundamental data. Note that our analysis may not factor in the latest price-sensitive company announcements or qualitative material. Simply Wall St has no position in any stocks mentioned.
Have feedback on this article? Concerned about the content? Get in touch with us directly. Alternatively, email editorial-team@simplywallst.com