
- PREMIUM
- LIVE QUOTES
- INSTITUTIONS
 Index Options
 State Street
 CME Group
 Nasdaq
 Cboe
Cboe TradingView
 Wall Street Journal
Understanding Amazon.com's Position In Broadline Retail Industry Compared To Competitors
In the dynamic and cutthroat world of business, conducting thorough company analysis is essential for investors and industry experts. In this article, we will undertake a comprehensive industry comparison, evaluating Amazon.com (NASDAQ:AMZN) and its primary competitors in the Broadline Retail industry. By closely examining key financial metrics, market position, and growth prospects, our aim is to provide valuable insights for investors and shed light on company's performance within the industry.
Amazon.com Background
Amazon is the leading online retailer and marketplace for third party sellers. Retail related revenue represents approximately 75% of total, followed by Amazon Web Services' cloud computing, storage, database, and other offerings (15%), advertising services (5% to 10%), and other the remainder. International segments constitute 25% to 30% of Amazon's non-AWS sales, led by Germany, the United Kingdom, and Japan.
| Company | P/E | P/B | P/S | ROE | EBITDA (in billions) | Gross Profit (in billions) | Revenue Growth |
|---|---|---|---|---|---|---|---|
| Amazon.com Inc | 35.73 | 7.61 | 3.63 | 5.79% | $36.48 | $78.69 | 8.62% |
| Alibaba Group Holding Ltd | 15.18 | 1.92 | 1.97 | 1.23% | $21.8 | $90.83 | 6.57% |
| PDD Holdings Inc | 11.20 | 3.23 | 2.76 | 4.59% | $16.09 | $54.73 | 10.21% |
| MercadoLibre Inc | 64.30 | 26.48 | 5.92 | 10.56% | $0.92 | $2.77 | 36.97% |
| Coupang Inc | 214 | 12.44 | 1.77 | 2.53% | $0.36 | $2.32 | 11.16% |
| JD.com Inc | 7.94 | 1.44 | 0.30 | 4.6% | $14.27 | $47.85 | 15.78% |
| eBay Inc | 17.90 | 6.93 | 3.54 | 9.95% | $0.77 | $1.86 | 1.13% |
| Ollie's Bargain Outlet Holdings Inc | 40.55 | 4.67 | 3.48 | 2.78% | $0.07 | $0.24 | 13.35% |
| Vipshop Holdings Ltd | 7.77 | 1.38 | 0.54 | 4.85% | $2.45 | $6.08 | -4.98% |
| Dillard's Inc | 11.57 | 3.52 | 1.02 | 8.97% | $0.26 | $0.69 | -1.64% |
| MINISO Group Holding Ltd | 16.59 | 3.76 | 2.30 | 3.98% | $0.65 | $1.96 | 18.89% |
| Macy's Inc | 5.89 | 0.71 | 0.14 | 0.84% | $0.31 | $2.0 | -4.14% |
| Savers Value Village Inc | 72.86 | 3.83 | 1.09 | -1.13% | $0.03 | $0.2 | 4.51% |
| Kohl's Corp | 7.78 | 0.25 | 0.06 | -0.4% | $0.23 | $1.4 | -4.41% |
| Hour Loop Inc | 143 | 8.65 | 0.36 | 11.93% | $0.0 | $0.01 | 4.68% |
| Average | 45.47 | 5.66 | 1.8 | 4.66% | $4.16 | $15.21 | 7.72% |
By analyzing Amazon.com, we can infer the following trends:
At 35.73, the stock's Price to Earnings ratio is 0.79x less than the industry average, suggesting favorable growth potential.
It could be trading at a premium in relation to its book value, as indicated by its Price to Book ratio of 7.61 which exceeds the industry average by 1.34x.
The stock's relatively high Price to Sales ratio of 3.63, surpassing the industry average by 2.02x, may indicate an aspect of overvaluation in terms of sales performance.
The Return on Equity (ROE) of 5.79% is 1.13% above the industry average, highlighting efficient use of equity to generate profits.
With higher Earnings Before Interest, Taxes, Depreciation, and Amortization (EBITDA) of $36.48 Billion, which is 8.77x above the industry average, the company demonstrates stronger profitability and robust cash flow generation.
The company has higher gross profit of $78.69 Billion, which indicates 5.17x above the industry average, indicating stronger profitability and higher earnings from its core operations.
The company is experiencing remarkable revenue growth, with a rate of 8.62%, outperforming the industry average of 7.72%.
Debt To Equity Ratio
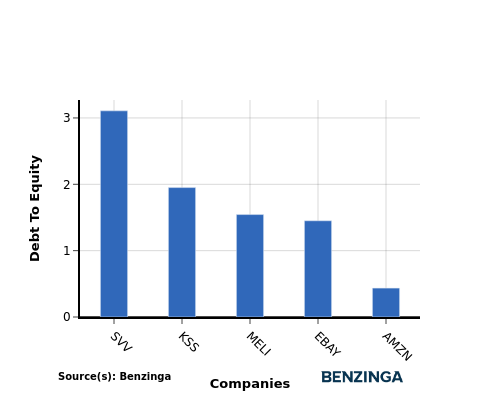
The debt-to-equity (D/E) ratio provides insights into the proportion of debt a company has in relation to its equity and asset value.
Considering the debt-to-equity ratio in industry comparisons allows for a concise evaluation of a company's financial health and risk profile, aiding in informed decision-making.
When assessing Amazon.com against its top 4 peers using the Debt-to-Equity ratio, the following comparisons can be made:
Compared to its top 4 peers, Amazon.com has a stronger financial position indicated by its lower debt-to-equity ratio of 0.44.
This suggests that the company relies less on debt financing and has a more favorable balance between debt and equity, which can be seen as a positive attribute by investors.
Key Takeaways
For Amazon.com, the PE ratio is low compared to its peers in the Broadline Retail industry, indicating potential undervaluation. The high PB and PS ratios suggest that the market values Amazon.com's assets and sales highly. In terms of ROE, EBITDA, gross profit, and revenue growth, Amazon.com outperforms its industry peers, reflecting strong financial performance and growth potential.
This article was generated by Benzinga's automated content engine and reviewed by an editor.