
- PREMIUM
- LIVE QUOTES
- INSTITUTIONS
 Index Options
 State Street
 CME Group
 Nasdaq
 Cboe
Cboe TradingView
 Wall Street Journal
Galectin Therapeutics Inc.'s (NASDAQ:GALT) stock price dropped 13% last week; individual investors would not be happy
Key Insights
- Galectin Therapeutics' significant individual investors ownership suggests that the key decisions are influenced by shareholders from the larger public
- A total of 25 investors have a majority stake in the company with 44% ownership
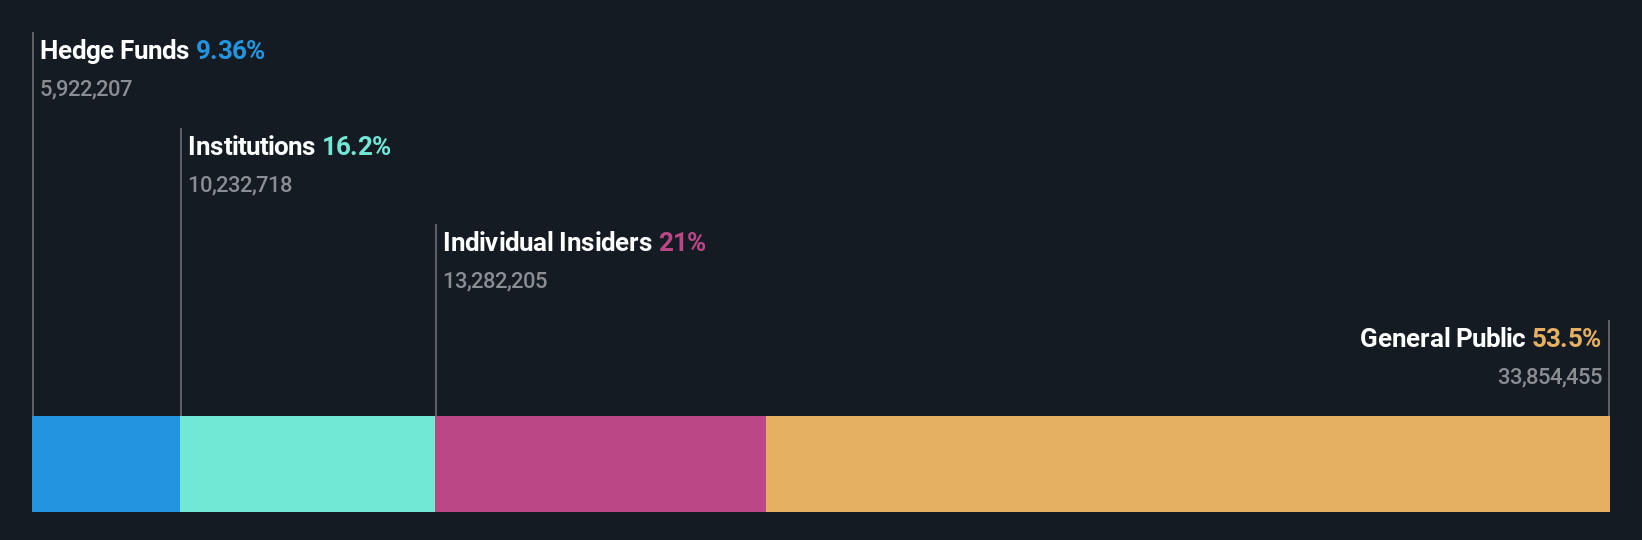
- Insiders own 21% of Galectin Therapeutics
Every investor in Galectin Therapeutics Inc. (NASDAQ:GALT) should be aware of the most powerful shareholder groups. The group holding the most number of shares in the company, around 53% to be precise, is individual investors. Put another way, the group faces the maximum upside potential (or downside risk).
While insiders, who own 21% shares weren’t spared from last week’s US$20m market cap drop, individual investors as a group suffered the maximum losses
In the chart below, we zoom in on the different ownership groups of Galectin Therapeutics.
Check out our latest analysis for Galectin Therapeutics
What Does The Institutional Ownership Tell Us About Galectin Therapeutics?
Institutions typically measure themselves against a benchmark when reporting to their own investors, so they often become more enthusiastic about a stock once it's included in a major index. We would expect most companies to have some institutions on the register, especially if they are growing.
We can see that Galectin Therapeutics does have institutional investors; and they hold a good portion of the company's stock. This implies the analysts working for those institutions have looked at the stock and they like it. But just like anyone else, they could be wrong. When multiple institutions own a stock, there's always a risk that they are in a 'crowded trade'. When such a trade goes wrong, multiple parties may compete to sell stock fast. This risk is higher in a company without a history of growth. You can see Galectin Therapeutics' historic earnings and revenue below, but keep in mind there's always more to the story.

It looks like hedge funds own 9.4% of Galectin Therapeutics shares. That catches my attention because hedge funds sometimes try to influence management, or bring about changes that will create near term value for shareholders. Looking at our data, we can see that the largest shareholder is Richard Uihlein with 16% of shares outstanding. 10x Capital Management, LLC is the second largest shareholder owning 9.4% of common stock, and The Vanguard Group, Inc. holds about 3.5% of the company stock. Furthermore, CEO Joel Lewis is the owner of 1.3% of the company's shares.
A deeper look at our ownership data shows that the top 25 shareholders collectively hold less than half of the register, suggesting a large group of small holders where no single shareholder has a majority.
While it makes sense to study institutional ownership data for a company, it also makes sense to study analyst sentiments to know which way the wind is blowing. There is some analyst coverage of the stock, but it could still become more well known, with time.
Insider Ownership Of Galectin Therapeutics
While the precise definition of an insider can be subjective, almost everyone considers board members to be insiders. Company management run the business, but the CEO will answer to the board, even if he or she is a member of it.
I generally consider insider ownership to be a good thing. However, on some occasions it makes it more difficult for other shareholders to hold the board accountable for decisions.
Our most recent data indicates that insiders own a reasonable proportion of Galectin Therapeutics Inc.. Insiders have a US$28m stake in this US$134m business. It is great to see insiders so invested in the business. It might be worth checking if those insiders have been buying recently.
General Public Ownership
The general public, mostly comprising of individual investors, collectively holds 53% of Galectin Therapeutics shares. This size of ownership gives investors from the general public some collective power. They can and probably do influence decisions on executive compensation, dividend policies and proposed business acquisitions.
Next Steps:
While it is well worth considering the different groups that own a company, there are other factors that are even more important. For example, we've discovered 6 warning signs for Galectin Therapeutics (5 are potentially serious!) that you should be aware of before investing here.
If you are like me, you may want to think about whether this company will grow or shrink. Luckily, you can check this free report showing analyst forecasts for its future.
NB: Figures in this article are calculated using data from the last twelve months, which refer to the 12-month period ending on the last date of the month the financial statement is dated. This may not be consistent with full year annual report figures.
Have feedback on this article? Concerned about the content? Get in touch with us directly. Alternatively, email editorial-team (at) simplywallst.com.
This article by Simply Wall St is general in nature. We provide commentary based on historical data and analyst forecasts only using an unbiased methodology and our articles are not intended to be financial advice. It does not constitute a recommendation to buy or sell any stock, and does not take account of your objectives, or your financial situation. We aim to bring you long-term focused analysis driven by fundamental data. Note that our analysis may not factor in the latest price-sensitive company announcements or qualitative material. Simply Wall St has no position in any stocks mentioned.