
- PREMIUM
- LIVE QUOTES
- INSTITUTIONS
 Index Options
 State Street
 CME Group
 Nasdaq
 Cboe
Cboe TradingView
 Wall Street Journal
We Think Tega Industries (NSE:TEGA) Can Stay On Top Of Its Debt
David Iben put it well when he said, 'Volatility is not a risk we care about. What we care about is avoiding the permanent loss of capital.' When we think about how risky a company is, we always like to look at its use of debt, since debt overload can lead to ruin. As with many other companies Tega Industries Limited (NSE:TEGA) makes use of debt. But is this debt a concern to shareholders?
What Risk Does Debt Bring?
Debt and other liabilities become risky for a business when it cannot easily fulfill those obligations, either with free cash flow or by raising capital at an attractive price. Ultimately, if the company can't fulfill its legal obligations to repay debt, shareholders could walk away with nothing. While that is not too common, we often do see indebted companies permanently diluting shareholders because lenders force them to raise capital at a distressed price. Of course, the upside of debt is that it often represents cheap capital, especially when it replaces dilution in a company with the ability to reinvest at high rates of return. When we think about a company's use of debt, we first look at cash and debt together.
What Is Tega Industries's Net Debt?
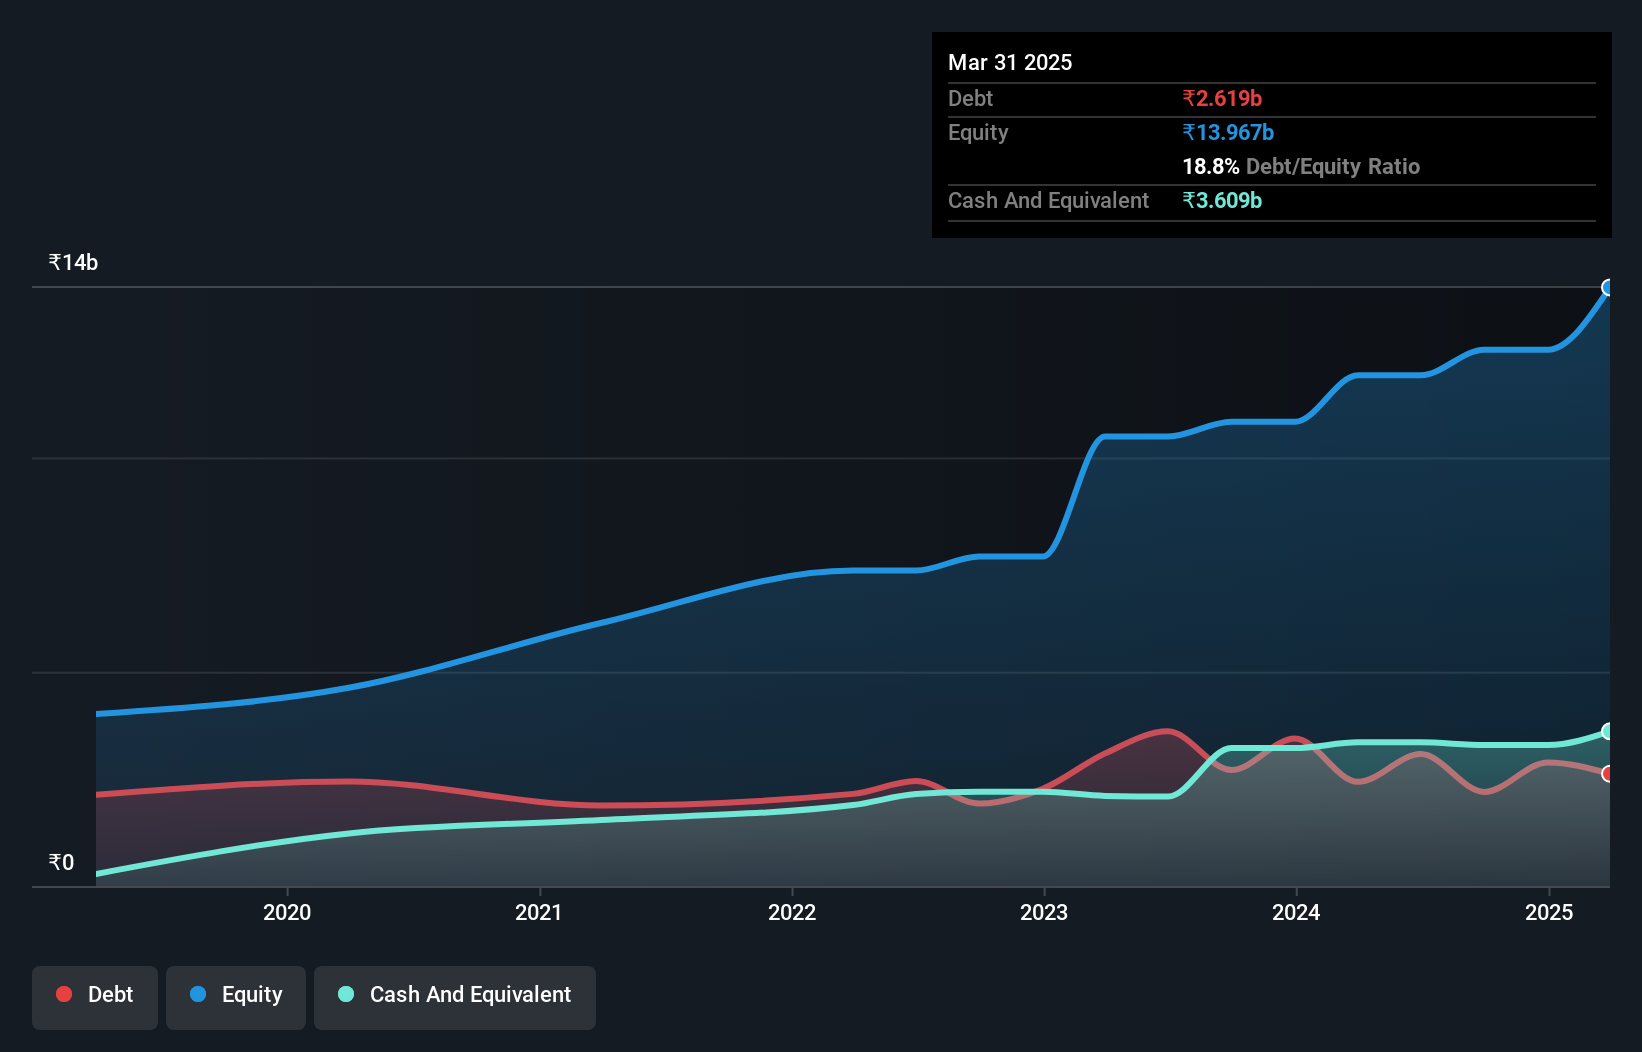
You can click the graphic below for the historical numbers, but it shows that as of March 2025 Tega Industries had ₹2.62b of debt, an increase on ₹2.43b, over one year. However, its balance sheet shows it holds ₹3.61b in cash, so it actually has ₹989.7m net cash.
How Strong Is Tega Industries' Balance Sheet?
According to the last reported balance sheet, Tega Industries had liabilities of ₹5.43b due within 12 months, and liabilities of ₹1.55b due beyond 12 months. Offsetting this, it had ₹3.61b in cash and ₹5.01b in receivables that were due within 12 months. So it can boast ₹1.63b more liquid assets than total liabilities.
Having regard to Tega Industries' size, it seems that its liquid assets are well balanced with its total liabilities. So it's very unlikely that the ₹103.6b company is short on cash, but still worth keeping an eye on the balance sheet. Simply put, the fact that Tega Industries has more cash than debt is arguably a good indication that it can manage its debt safely.
Check out our latest analysis for Tega Industries
But the other side of the story is that Tega Industries saw its EBIT decline by 5.5% over the last year. That sort of decline, if sustained, will obviously make debt harder to handle. When analysing debt levels, the balance sheet is the obvious place to start. But ultimately the future profitability of the business will decide if Tega Industries can strengthen its balance sheet over time. So if you're focused on the future you can check out this free report showing analyst profit forecasts.
Finally, while the tax-man may adore accounting profits, lenders only accept cold hard cash. Tega Industries may have net cash on the balance sheet, but it is still interesting to look at how well the business converts its earnings before interest and tax (EBIT) to free cash flow, because that will influence both its need for, and its capacity to manage debt. In the last three years, Tega Industries's free cash flow amounted to 43% of its EBIT, less than we'd expect. That weak cash conversion makes it more difficult to handle indebtedness.
Summing Up
While we empathize with investors who find debt concerning, you should keep in mind that Tega Industries has net cash of ₹989.7m, as well as more liquid assets than liabilities. So we don't have any problem with Tega Industries's use of debt. Above most other metrics, we think its important to track how fast earnings per share is growing, if at all. If you've also come to that realization, you're in luck, because today you can view this interactive graph of Tega Industries's earnings per share history for free.
When all is said and done, sometimes its easier to focus on companies that don't even need debt. Readers can access a list of growth stocks with zero net debt 100% free, right now.
Have feedback on this article? Concerned about the content? Get in touch with us directly. Alternatively, email editorial-team (at) simplywallst.com.
This article by Simply Wall St is general in nature. We provide commentary based on historical data and analyst forecasts only using an unbiased methodology and our articles are not intended to be financial advice. It does not constitute a recommendation to buy or sell any stock, and does not take account of your objectives, or your financial situation. We aim to bring you long-term focused analysis driven by fundamental data. Note that our analysis may not factor in the latest price-sensitive company announcements or qualitative material. Simply Wall St has no position in any stocks mentioned.