
- PREMIUM
- LIVE QUOTES
- INSTITUTIONS
 Index Options
 State Street
 CME Group
 Nasdaq
 Cboe
Cboe TradingView
 Wall Street Journal
Private companies in SJM Holdings Limited (HKG:880) are its biggest bettors, and their bets paid off as stock gained 10% last week
Key Insights
- Significant control over SJM Holdings by private companies implies that the general public has more power to influence management and governance-related decisions
- The largest shareholder of the company is Macau Tourism And Amusement Company Limited with a 55% stake
- Analyst forecasts along with ownership data serve to give a strong idea about prospects for a business
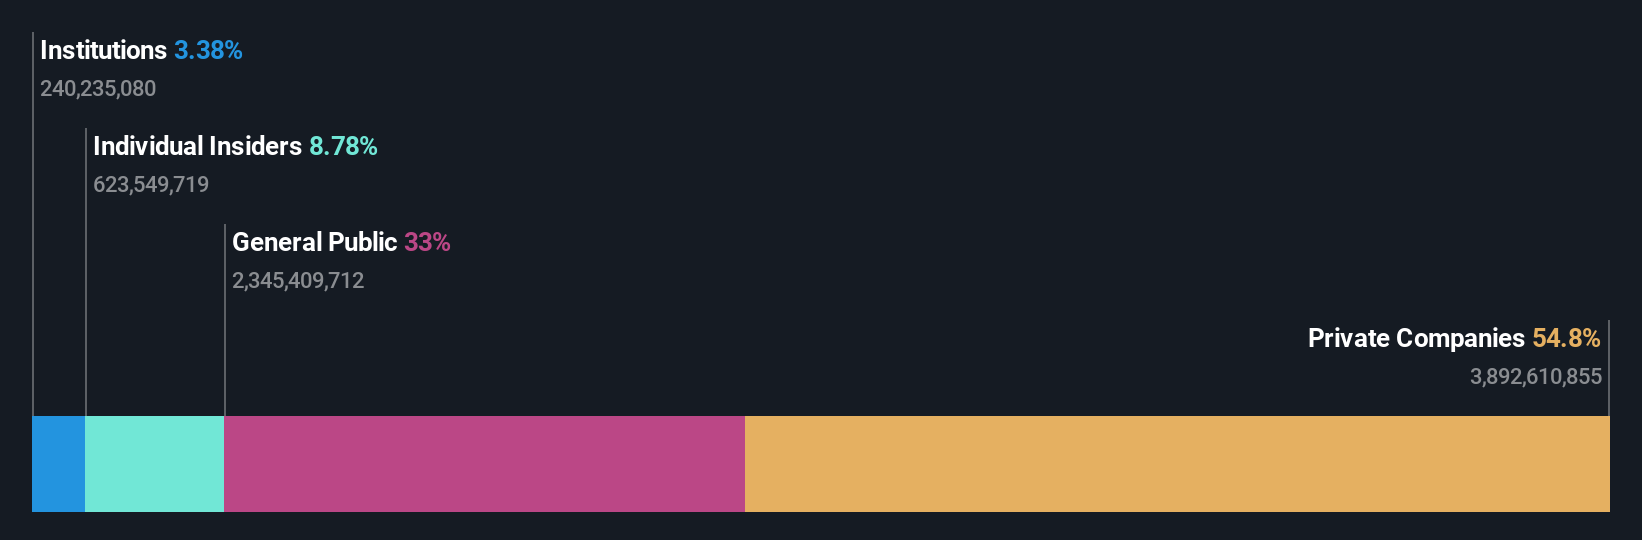
If you want to know who really controls SJM Holdings Limited (HKG:880), then you'll have to look at the makeup of its share registry. And the group that holds the biggest piece of the pie are private companies with 55% ownership. In other words, the group stands to gain the most (or lose the most) from their investment into the company.
As a result, private companies collectively scored the highest last week as the company hit HK$18b market cap following a 10% gain in the stock.
Let's take a closer look to see what the different types of shareholders can tell us about SJM Holdings.
See our latest analysis for SJM Holdings
What Does The Institutional Ownership Tell Us About SJM Holdings?
Institutional investors commonly compare their own returns to the returns of a commonly followed index. So they generally do consider buying larger companies that are included in the relevant benchmark index.
Institutions have a very small stake in SJM Holdings. That indicates that the company is on the radar of some funds, but it isn't particularly popular with professional investors at the moment. If the business gets stronger from here, we could see a situation where more institutions are keen to buy. It is not uncommon to see a big share price rise if multiple institutional investors are trying to buy into a stock at the same time. So check out the historic earnings trajectory, below, but keep in mind it's the future that counts most.

We note that hedge funds don't have a meaningful investment in SJM Holdings. Macau Tourism And Amusement Company Limited is currently the largest shareholder, with 55% of shares outstanding. This implies that they have majority interest control of the future of the company. For context, the second largest shareholder holds about 8.1% of the shares outstanding, followed by an ownership of 1.3% by the third-largest shareholder. On Kei Leong, who is the second-largest shareholder, also happens to hold the title of Top Key Executive.
Researching institutional ownership is a good way to gauge and filter a stock's expected performance. The same can be achieved by studying analyst sentiments. There are plenty of analysts covering the stock, so it might be worth seeing what they are forecasting, too.
Insider Ownership Of SJM Holdings
The definition of company insiders can be subjective and does vary between jurisdictions. Our data reflects individual insiders, capturing board members at the very least. The company management answer to the board and the latter should represent the interests of shareholders. Notably, sometimes top-level managers are on the board themselves.
Most consider insider ownership a positive because it can indicate the board is well aligned with other shareholders. However, on some occasions too much power is concentrated within this group.
Shareholders would probably be interested to learn that insiders own shares in SJM Holdings Limited. This is a big company, so it is good to see this level of alignment. Insiders own HK$1.6b worth of shares (at current prices). If you would like to explore the question of insider alignment, you can click here to see if insiders have been buying or selling.
General Public Ownership
With a 33% ownership, the general public, mostly comprising of individual investors, have some degree of sway over SJM Holdings. This size of ownership, while considerable, may not be enough to change company policy if the decision is not in sync with other large shareholders.
Private Company Ownership
We can see that Private Companies own 55%, of the shares on issue. Private companies may be related parties. Sometimes insiders have an interest in a public company through a holding in a private company, rather than in their own capacity as an individual. While it's hard to draw any broad stroke conclusions, it is worth noting as an area for further research.
Next Steps:
It's always worth thinking about the different groups who own shares in a company. But to understand SJM Holdings better, we need to consider many other factors. For instance, we've identified 1 warning sign for SJM Holdings that you should be aware of.
Ultimately the future is most important. You can access this free report on analyst forecasts for the company.
NB: Figures in this article are calculated using data from the last twelve months, which refer to the 12-month period ending on the last date of the month the financial statement is dated. This may not be consistent with full year annual report figures.
Have feedback on this article? Concerned about the content? Get in touch with us directly. Alternatively, email editorial-team (at) simplywallst.com.
This article by Simply Wall St is general in nature. We provide commentary based on historical data and analyst forecasts only using an unbiased methodology and our articles are not intended to be financial advice. It does not constitute a recommendation to buy or sell any stock, and does not take account of your objectives, or your financial situation. We aim to bring you long-term focused analysis driven by fundamental data. Note that our analysis may not factor in the latest price-sensitive company announcements or qualitative material. Simply Wall St has no position in any stocks mentioned.