
Private companies in Aperam S.A. (AMS:APAM) are its biggest bettors, and their bets paid off as stock gained 4.7% last week
Key Insights
- Significant control over Aperam by private companies implies that the general public has more power to influence management and governance-related decisions
- The top 5 shareholders own 50% of the company
- Institutional ownership in Aperam is 23%
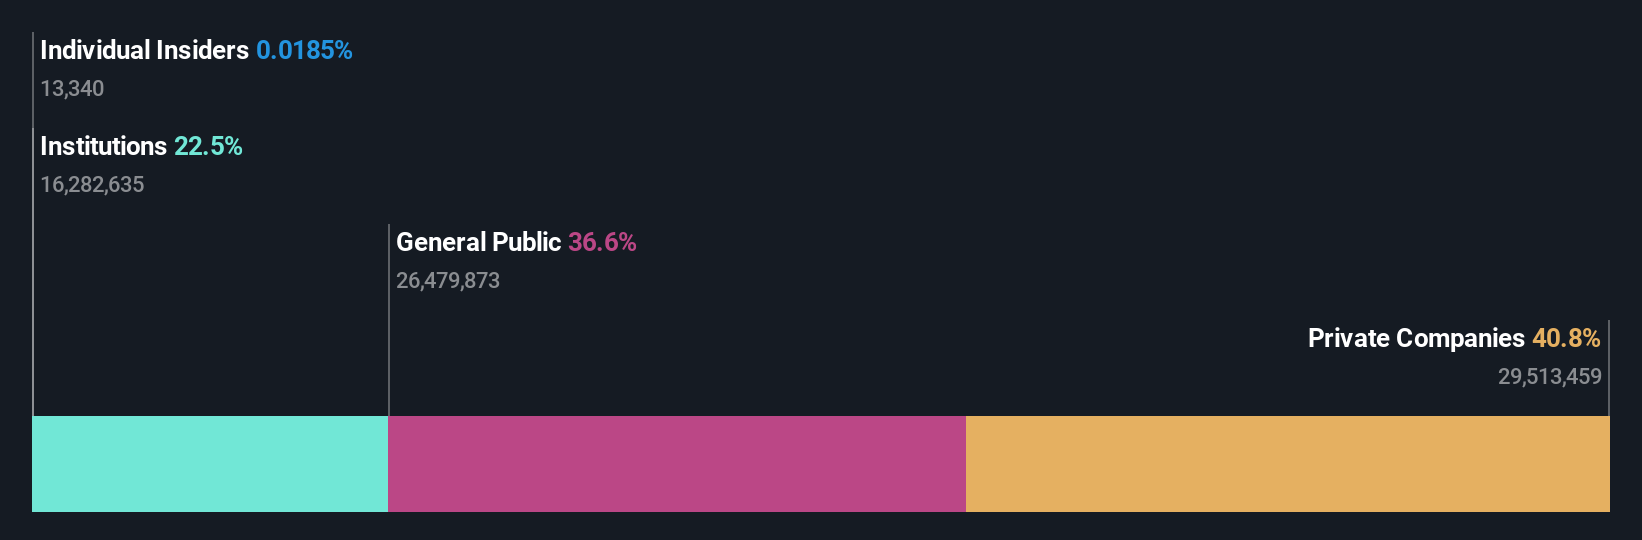
To get a sense of who is truly in control of Aperam S.A. (AMS:APAM), it is important to understand the ownership structure of the business. We can see that private companies own the lion's share in the company with 41% ownership. In other words, the group stands to gain the most (or lose the most) from their investment into the company.
Clearly, private companies benefitted the most after the company's market cap rose by €90m last week.
In the chart below, we zoom in on the different ownership groups of Aperam.
Check out our latest analysis for Aperam
What Does The Institutional Ownership Tell Us About Aperam?
Institutions typically measure themselves against a benchmark when reporting to their own investors, so they often become more enthusiastic about a stock once it's included in a major index. We would expect most companies to have some institutions on the register, especially if they are growing.
As you can see, institutional investors have a fair amount of stake in Aperam. This suggests some credibility amongst professional investors. But we can't rely on that fact alone since institutions make bad investments sometimes, just like everyone does. When multiple institutions own a stock, there's always a risk that they are in a 'crowded trade'. When such a trade goes wrong, multiple parties may compete to sell stock fast. This risk is higher in a company without a history of growth. You can see Aperam's historic earnings and revenue below, but keep in mind there's always more to the story.

We note that hedge funds don't have a meaningful investment in Aperam. Value Holdings II Sarl is currently the company's largest shareholder with 41% of shares outstanding. The second and third largest shareholders are Deutsche Asset & Wealth Management and Dimensional Fund Advisors LP, with an equal amount of shares to their name at 2.5%.
Our research also brought to light the fact that roughly 50% of the company is controlled by the top 5 shareholders suggesting that these owners wield significant influence on the business.
While it makes sense to study institutional ownership data for a company, it also makes sense to study analyst sentiments to know which way the wind is blowing. There are a reasonable number of analysts covering the stock, so it might be useful to find out their aggregate view on the future.
Insider Ownership Of Aperam
The definition of company insiders can be subjective and does vary between jurisdictions. Our data reflects individual insiders, capturing board members at the very least. Company management run the business, but the CEO will answer to the board, even if he or she is a member of it.
I generally consider insider ownership to be a good thing. However, on some occasions it makes it more difficult for other shareholders to hold the board accountable for decisions.
Our information suggests that Aperam S.A. insiders own under 1% of the company. But they may have an indirect interest through a corporate structure that we haven't picked up on. Keep in mind that it's a big company, and the insiders own €370k worth of shares. The absolute value might be more important than the proportional share. It is always good to see at least some insider ownership, but it might be worth checking if those insiders have been selling.
General Public Ownership
The general public, who are usually individual investors, hold a 37% stake in Aperam. While this size of ownership may not be enough to sway a policy decision in their favour, they can still make a collective impact on company policies.
Private Company Ownership
We can see that Private Companies own 41%, of the shares on issue. Private companies may be related parties. Sometimes insiders have an interest in a public company through a holding in a private company, rather than in their own capacity as an individual. While it's hard to draw any broad stroke conclusions, it is worth noting as an area for further research.
Next Steps:
It's always worth thinking about the different groups who own shares in a company. But to understand Aperam better, we need to consider many other factors. For example, we've discovered 1 warning sign for Aperam that you should be aware of before investing here.
But ultimately it is the future, not the past, that will determine how well the owners of this business will do. Therefore we think it advisable to take a look at this free report showing whether analysts are predicting a brighter future.
NB: Figures in this article are calculated using data from the last twelve months, which refer to the 12-month period ending on the last date of the month the financial statement is dated. This may not be consistent with full year annual report figures.
Have feedback on this article? Concerned about the content? Get in touch with us directly. Alternatively, email editorial-team (at) simplywallst.com.
This article by Simply Wall St is general in nature. We provide commentary based on historical data and analyst forecasts only using an unbiased methodology and our articles are not intended to be financial advice. It does not constitute a recommendation to buy or sell any stock, and does not take account of your objectives, or your financial situation. We aim to bring you long-term focused analysis driven by fundamental data. Note that our analysis may not factor in the latest price-sensitive company announcements or qualitative material. Simply Wall St has no position in any stocks mentioned.