
Private companies who hold 55% of Fraser & Neave Holdings Bhd (KLSE:F&N) gained 3.4%, institutions profited as well
Key Insights
- Significant control over Fraser & Neave Holdings Bhd by private companies implies that the general public has more power to influence management and governance-related decisions
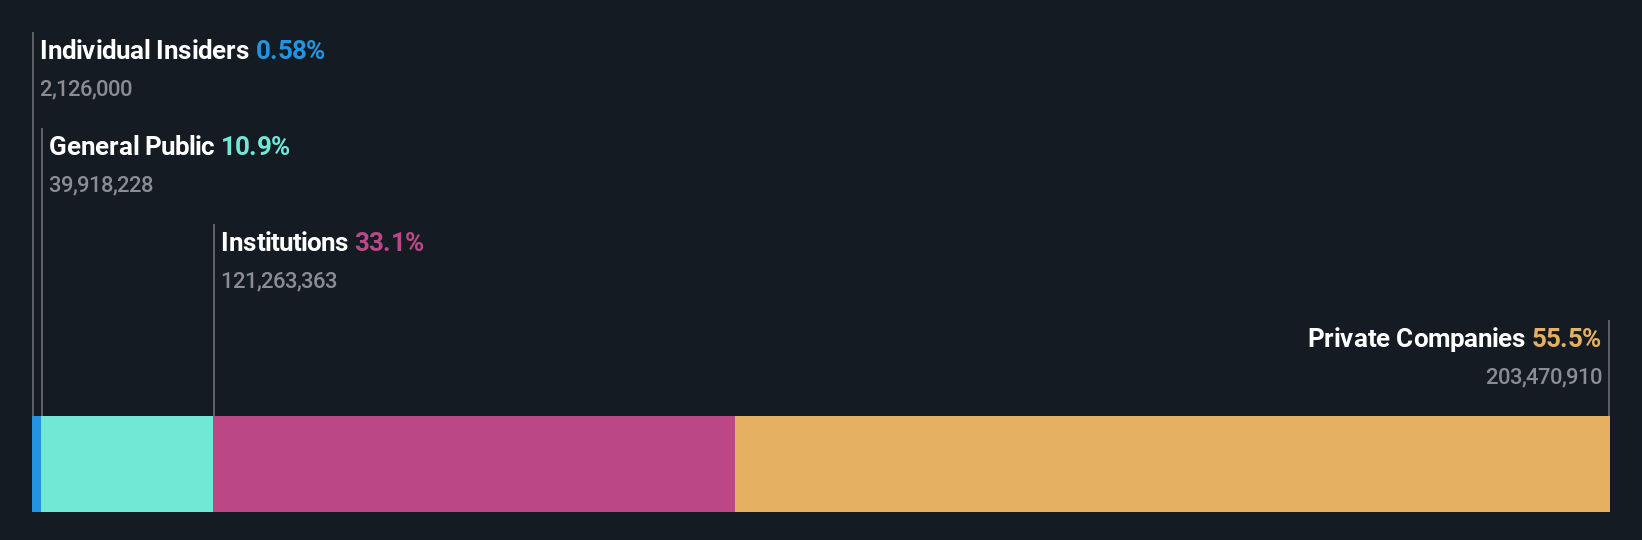
- 55% of the company is held by a single shareholder (TCC Assets Limited)
- 33% of Fraser & Neave Holdings Bhd is held by Institutions
A look at the shareholders of Fraser & Neave Holdings Bhd (KLSE:F&N) can tell us which group is most powerful. With 55% stake, private companies possess the maximum shares in the company. Put another way, the group faces the maximum upside potential (or downside risk).
While private companies were the group that benefitted the most from last week’s RM345m market cap gain, institutions too had a 33% share in those profits.
Let's take a closer look to see what the different types of shareholders can tell us about Fraser & Neave Holdings Bhd.
See our latest analysis for Fraser & Neave Holdings Bhd
What Does The Institutional Ownership Tell Us About Fraser & Neave Holdings Bhd?
Many institutions measure their performance against an index that approximates the local market. So they usually pay more attention to companies that are included in major indices.
As you can see, institutional investors have a fair amount of stake in Fraser & Neave Holdings Bhd. This can indicate that the company has a certain degree of credibility in the investment community. However, it is best to be wary of relying on the supposed validation that comes with institutional investors. They too, get it wrong sometimes. If multiple institutions change their view on a stock at the same time, you could see the share price drop fast. It's therefore worth looking at Fraser & Neave Holdings Bhd's earnings history below. Of course, the future is what really matters.

We note that hedge funds don't have a meaningful investment in Fraser & Neave Holdings Bhd. TCC Assets Limited is currently the company's largest shareholder with 55% of shares outstanding. With such a huge stake in the ownership, we infer that they have significant control of the future of the company. For context, the second largest shareholder holds about 12% of the shares outstanding, followed by an ownership of 8.9% by the third-largest shareholder.
While studying institutional ownership for a company can add value to your research, it is also a good practice to research analyst recommendations to get a deeper understand of a stock's expected performance. Quite a few analysts cover the stock, so you could look into forecast growth quite easily.
Insider Ownership Of Fraser & Neave Holdings Bhd
The definition of company insiders can be subjective and does vary between jurisdictions. Our data reflects individual insiders, capturing board members at the very least. The company management answer to the board and the latter should represent the interests of shareholders. Notably, sometimes top-level managers are on the board themselves.
Most consider insider ownership a positive because it can indicate the board is well aligned with other shareholders. However, on some occasions too much power is concentrated within this group.
Our data suggests that insiders own under 1% of Fraser & Neave Holdings Bhd in their own names. However, it's possible that insiders might have an indirect interest through a more complex structure. It's a big company, so even a small proportional interest can create alignment between the board and shareholders. In this case insiders own RM60m worth of shares. It is always good to see at least some insider ownership, but it might be worth checking if those insiders have been selling.
General Public Ownership
With a 11% ownership, the general public, mostly comprising of individual investors, have some degree of sway over Fraser & Neave Holdings Bhd. While this size of ownership may not be enough to sway a policy decision in their favour, they can still make a collective impact on company policies.
Private Company Ownership
It seems that Private Companies own 55%, of the Fraser & Neave Holdings Bhd stock. It's hard to draw any conclusions from this fact alone, so its worth looking into who owns those private companies. Sometimes insiders or other related parties have an interest in shares in a public company through a separate private company.

Next Steps:
It's always worth thinking about the different groups who own shares in a company. But to understand Fraser & Neave Holdings Bhd better, we need to consider many other factors. Consider risks, for instance. Every company has them, and we've spotted 1 warning sign for Fraser & Neave Holdings Bhd you should know about.
If you would prefer discover what analysts are predicting in terms of future growth, do not miss this free report on analyst forecasts.
NB: Figures in this article are calculated using data from the last twelve months, which refer to the 12-month period ending on the last date of the month the financial statement is dated. This may not be consistent with full year annual report figures.
Have feedback on this article? Concerned about the content? Get in touch with us directly. Alternatively, email editorial-team (at) simplywallst.com.
This article by Simply Wall St is general in nature. We provide commentary based on historical data and analyst forecasts only using an unbiased methodology and our articles are not intended to be financial advice. It does not constitute a recommendation to buy or sell any stock, and does not take account of your objectives, or your financial situation. We aim to bring you long-term focused analysis driven by fundamental data. Note that our analysis may not factor in the latest price-sensitive company announcements or qualitative material. Simply Wall St has no position in any stocks mentioned.