
- PREMIUM
- LIVE QUOTES
- INSTITUTIONS
 Index Options
 State Street
 CME Group
 Nasdaq
 Cboe
Cboe TradingView
 Wall Street Journal
Is NCC Limited (NSE:NCC) Worth ₹227 Based On Its Intrinsic Value?
Key Insights
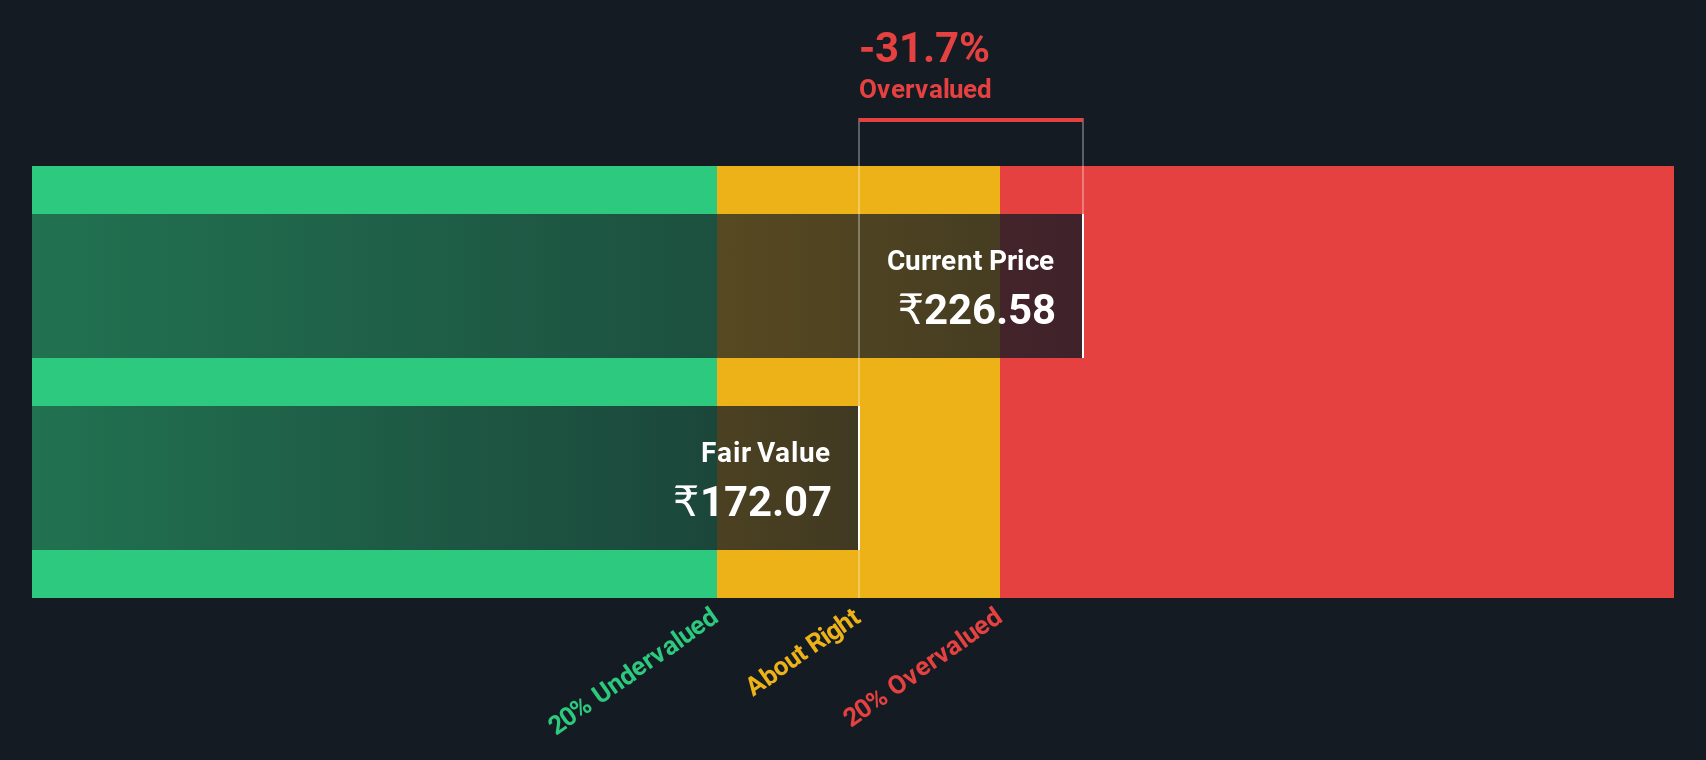
- The projected fair value for NCC is ₹172 based on 2 Stage Free Cash Flow to Equity
- NCC's ₹227 share price signals that it might be 32% overvalued
- The ₹274 analyst price target for NCC is 59% more than our estimate of fair value
Today we'll do a simple run through of a valuation method used to estimate the attractiveness of NCC Limited (NSE:NCC) as an investment opportunity by taking the expected future cash flows and discounting them to today's value. We will take advantage of the Discounted Cash Flow (DCF) model for this purpose. Before you think you won't be able to understand it, just read on! It's actually much less complex than you'd imagine.
We generally believe that a company's value is the present value of all of the cash it will generate in the future. However, a DCF is just one valuation metric among many, and it is not without flaws. If you want to learn more about discounted cash flow, the rationale behind this calculation can be read in detail in the Simply Wall St analysis model.
The Calculation
We use what is known as a 2-stage model, which simply means we have two different periods of growth rates for the company's cash flows. Generally the first stage is higher growth, and the second stage is a lower growth phase. In the first stage we need to estimate the cash flows to the business over the next ten years. Where possible we use analyst estimates, but when these aren't available we extrapolate the previous free cash flow (FCF) from the last estimate or reported value. We assume companies with shrinking free cash flow will slow their rate of shrinkage, and that companies with growing free cash flow will see their growth rate slow, over this period. We do this to reflect that growth tends to slow more in the early years than it does in later years.
A DCF is all about the idea that a dollar in the future is less valuable than a dollar today, and so the sum of these future cash flows is then discounted to today's value:
10-year free cash flow (FCF) estimate
| 2025 | 2026 | 2027 | 2028 | 2029 | 2030 | 2031 | 2032 | 2033 | 2034 | |
| Levered FCF (₹, Millions) | -₹1.74b | ₹6.67b | ₹8.07b | ₹9.95b | ₹11.5b | ₹13.0b | ₹14.4b | ₹15.8b | ₹17.2b | ₹18.6b |
| Growth Rate Estimate Source | Analyst x8 | Analyst x5 | Analyst x6 | Analyst x2 | Est @ 15.47% | Est @ 12.85% | Est @ 11.02% | Est @ 9.73% | Est @ 8.84% | Est @ 8.21% |
| Present Value (₹, Millions) Discounted @ 15% | -₹1.5k | ₹5.1k | ₹5.3k | ₹5.7k | ₹5.8k | ₹5.7k | ₹5.5k | ₹5.2k | ₹5.0k | ₹4.7k |
("Est" = FCF growth rate estimated by Simply Wall St)
Present Value of 10-year Cash Flow (PVCF) = ₹46b
We now need to calculate the Terminal Value, which accounts for all the future cash flows after this ten year period. The Gordon Growth formula is used to calculate Terminal Value at a future annual growth rate equal to the 5-year average of the 10-year government bond yield of 6.7%. We discount the terminal cash flows to today's value at a cost of equity of 15%.
Terminal Value (TV)= FCF2034 × (1 + g) ÷ (r – g) = ₹19b× (1 + 6.7%) ÷ (15%– 6.7%) = ₹246b
Present Value of Terminal Value (PVTV)= TV / (1 + r)10= ₹246b÷ ( 1 + 15%)10= ₹62b
The total value, or equity value, is then the sum of the present value of the future cash flows, which in this case is ₹108b. In the final step we divide the equity value by the number of shares outstanding. Relative to the current share price of ₹227, the company appears potentially overvalued at the time of writing. The assumptions in any calculation have a big impact on the valuation, so it is better to view this as a rough estimate, not precise down to the last cent.
The Assumptions
We would point out that the most important inputs to a discounted cash flow are the discount rate and of course the actual cash flows. You don't have to agree with these inputs, I recommend redoing the calculations yourself and playing with them. The DCF also does not consider the possible cyclicality of an industry, or a company's future capital requirements, so it does not give a full picture of a company's potential performance. Given that we are looking at NCC as potential shareholders, the cost of equity is used as the discount rate, rather than the cost of capital (or weighted average cost of capital, WACC) which accounts for debt. In this calculation we've used 15%, which is based on a levered beta of 1.113. Beta is a measure of a stock's volatility, compared to the market as a whole. We get our beta from the industry average beta of globally comparable companies, with an imposed limit between 0.8 and 2.0, which is a reasonable range for a stable business.
Check out our latest analysis for NCC
SWOT Analysis for NCC
- Debt is well covered by cash flow.
- Dividends are covered by earnings and cash flows.
- Earnings growth over the past year underperformed the Construction industry.
- Interest payments on debt are not well covered.
- Dividend is low compared to the top 25% of dividend payers in the Construction market.
- Annual earnings are forecast to grow faster than the Indian market.
- Good value based on P/E ratio compared to estimated Fair P/E ratio.
- Annual revenue is forecast to grow slower than the Indian market.

Looking Ahead:
Although the valuation of a company is important, it is only one of many factors that you need to assess for a company. It's not possible to obtain a foolproof valuation with a DCF model. Preferably you'd apply different cases and assumptions and see how they would impact the company's valuation. For example, changes in the company's cost of equity or the risk free rate can significantly impact the valuation. What is the reason for the share price exceeding the intrinsic value? For NCC, we've compiled three relevant aspects you should assess:
- Risks: Be aware that NCC is showing 1 warning sign in our investment analysis , you should know about...
- Future Earnings: How does NCC's growth rate compare to its peers and the wider market? Dig deeper into the analyst consensus number for the upcoming years by interacting with our free analyst growth expectation chart.
- Other Solid Businesses: Low debt, high returns on equity and good past performance are fundamental to a strong business. Why not explore our interactive list of stocks with solid business fundamentals to see if there are other companies you may not have considered!
PS. The Simply Wall St app conducts a discounted cash flow valuation for every stock on the NSEI every day. If you want to find the calculation for other stocks just search here.
Have feedback on this article? Concerned about the content? Get in touch with us directly. Alternatively, email editorial-team (at) simplywallst.com.
This article by Simply Wall St is general in nature. We provide commentary based on historical data and analyst forecasts only using an unbiased methodology and our articles are not intended to be financial advice. It does not constitute a recommendation to buy or sell any stock, and does not take account of your objectives, or your financial situation. We aim to bring you long-term focused analysis driven by fundamental data. Note that our analysis may not factor in the latest price-sensitive company announcements or qualitative material. Simply Wall St has no position in any stocks mentioned.