
Max Financial Services Limited (NSE:MFSL) is a favorite amongst institutional investors who own 60%
Key Insights
- Significantly high institutional ownership implies Max Financial Services' stock price is sensitive to their trading actions
- A total of 7 investors have a majority stake in the company with 51% ownership
- Using data from analyst forecasts alongside ownership research, one can better assess the future performance of a company
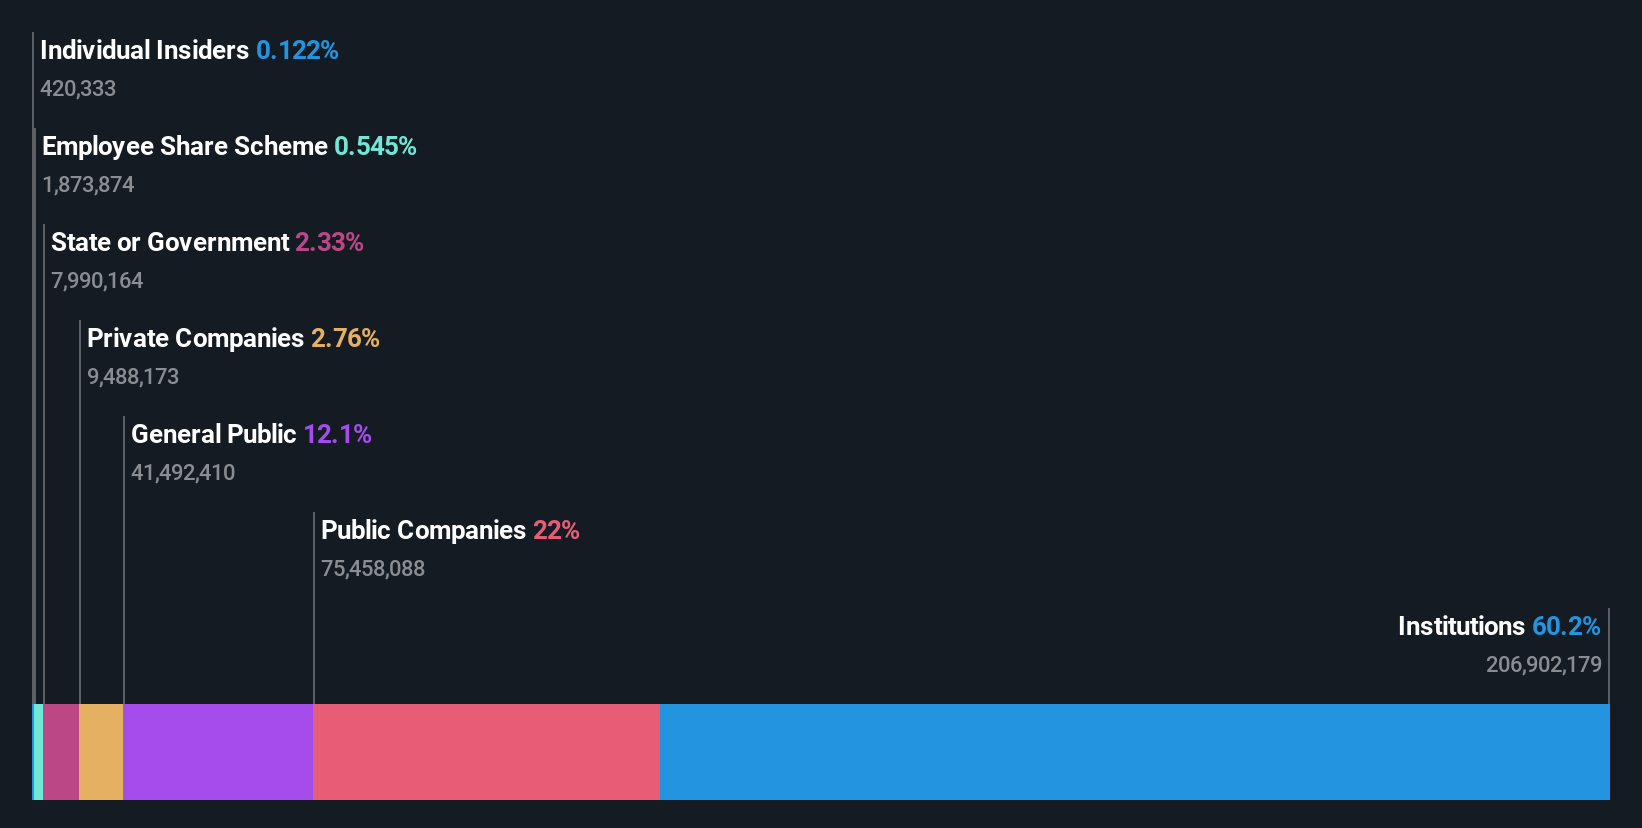
A look at the shareholders of Max Financial Services Limited (NSE:MFSL) can tell us which group is most powerful. We can see that institutions own the lion's share in the company with 60% ownership. In other words, the group stands to gain the most (or lose the most) from their investment into the company.
Since institutional have access to huge amounts of capital, their market moves tend to receive a lot of scrutiny by retail or individual investors. Hence, having a considerable amount of institutional money invested in a company is often regarded as a desirable trait.
Let's delve deeper into each type of owner of Max Financial Services, beginning with the chart below.
View our latest analysis for Max Financial Services
What Does The Institutional Ownership Tell Us About Max Financial Services?
Institutions typically measure themselves against a benchmark when reporting to their own investors, so they often become more enthusiastic about a stock once it's included in a major index. We would expect most companies to have some institutions on the register, especially if they are growing.
As you can see, institutional investors have a fair amount of stake in Max Financial Services. This implies the analysts working for those institutions have looked at the stock and they like it. But just like anyone else, they could be wrong. It is not uncommon to see a big share price drop if two large institutional investors try to sell out of a stock at the same time. So it is worth checking the past earnings trajectory of Max Financial Services, (below). Of course, keep in mind that there are other factors to consider, too.

Since institutional investors own more than half the issued stock, the board will likely have to pay attention to their preferences. Hedge funds don't have many shares in Max Financial Services. MS&AD Insurance Group Holdings, Inc. is currently the company's largest shareholder with 22% of shares outstanding. For context, the second largest shareholder holds about 9.1% of the shares outstanding, followed by an ownership of 5.9% by the third-largest shareholder.
We did some more digging and found that 7 of the top shareholders account for roughly 51% of the register, implying that along with larger shareholders, there are a few smaller shareholders, thereby balancing out each others interests somewhat.
While it makes sense to study institutional ownership data for a company, it also makes sense to study analyst sentiments to know which way the wind is blowing. There are plenty of analysts covering the stock, so it might be worth seeing what they are forecasting, too.
Insider Ownership Of Max Financial Services
While the precise definition of an insider can be subjective, almost everyone considers board members to be insiders. Management ultimately answers to the board. However, it is not uncommon for managers to be executive board members, especially if they are a founder or the CEO.
I generally consider insider ownership to be a good thing. However, on some occasions it makes it more difficult for other shareholders to hold the board accountable for decisions.
Our information suggests that Max Financial Services Limited insiders own under 1% of the company. We do note, however, it is possible insiders have an indirect interest through a private company or other corporate structure. Keep in mind that it's a big company, and the insiders own ₹646m worth of shares. The absolute value might be more important than the proportional share. It is good to see board members owning shares, but it might be worth checking if those insiders have been buying.
General Public Ownership
The general public, who are usually individual investors, hold a 12% stake in Max Financial Services. This size of ownership, while considerable, may not be enough to change company policy if the decision is not in sync with other large shareholders.
Public Company Ownership
Public companies currently own 22% of Max Financial Services stock. This may be a strategic interest and the two companies may have related business interests. It could be that they have de-merged. This holding is probably worth investigating further.

Next Steps:
I find it very interesting to look at who exactly owns a company. But to truly gain insight, we need to consider other information, too.
Many find it useful to take an in depth look at how a company has performed in the past. You can access this detailed graph of past earnings, revenue and cash flow.
If you would prefer discover what analysts are predicting in terms of future growth, do not miss this free report on analyst forecasts.
NB: Figures in this article are calculated using data from the last twelve months, which refer to the 12-month period ending on the last date of the month the financial statement is dated. This may not be consistent with full year annual report figures.
Have feedback on this article? Concerned about the content? Get in touch with us directly. Alternatively, email editorial-team (at) simplywallst.com.
This article by Simply Wall St is general in nature. We provide commentary based on historical data and analyst forecasts only using an unbiased methodology and our articles are not intended to be financial advice. It does not constitute a recommendation to buy or sell any stock, and does not take account of your objectives, or your financial situation. We aim to bring you long-term focused analysis driven by fundamental data. Note that our analysis may not factor in the latest price-sensitive company announcements or qualitative material. Simply Wall St has no position in any stocks mentioned.