
Kia Corporation (KRX:000270) stock most popular amongst public companies who own 35%, while individual investors hold 33%
Key Insights
- Kia's significant public companies ownership suggests that the key decisions are influenced by shareholders from the larger public
- 51% of the business is held by the top 6 shareholders
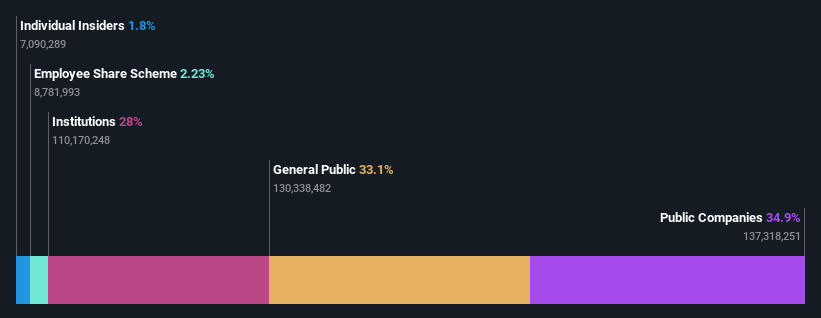
- 28% of Kia is held by Institutions
A look at the shareholders of Kia Corporation (KRX:000270) can tell us which group is most powerful. With 35% stake, public companies possess the maximum shares in the company. In other words, the group stands to gain the most (or lose the most) from their investment into the company.
Individual investors, on the other hand, account for 33% of the company's stockholders.
Let's delve deeper into each type of owner of Kia, beginning with the chart below.
Check out our latest analysis for Kia
What Does The Institutional Ownership Tell Us About Kia?
Institutional investors commonly compare their own returns to the returns of a commonly followed index. So they generally do consider buying larger companies that are included in the relevant benchmark index.
As you can see, institutional investors have a fair amount of stake in Kia. This implies the analysts working for those institutions have looked at the stock and they like it. But just like anyone else, they could be wrong. If multiple institutions change their view on a stock at the same time, you could see the share price drop fast. It's therefore worth looking at Kia's earnings history below. Of course, the future is what really matters.

Hedge funds don't have many shares in Kia. Looking at our data, we can see that the largest shareholder is Hyundai Motor Company with 35% of shares outstanding. National Pension Service is the second largest shareholder owning 7.2% of common stock, and BlackRock, Inc. holds about 2.5% of the company stock.
On further inspection, we found that more than half the company's shares are owned by the top 6 shareholders, suggesting that the interests of the larger shareholders are balanced out to an extent by the smaller ones.
While studying institutional ownership for a company can add value to your research, it is also a good practice to research analyst recommendations to get a deeper understand of a stock's expected performance. There are a reasonable number of analysts covering the stock, so it might be useful to find out their aggregate view on the future.
Insider Ownership Of Kia
The definition of an insider can differ slightly between different countries, but members of the board of directors always count. Management ultimately answers to the board. However, it is not uncommon for managers to be executive board members, especially if they are a founder or the CEO.
Insider ownership is positive when it signals leadership are thinking like the true owners of the company. However, high insider ownership can also give immense power to a small group within the company. This can be negative in some circumstances.
Shareholders would probably be interested to learn that insiders own shares in Kia Corporation. Insiders own ₩631b worth of shares (at current prices). we sometimes take an interest in whether they have been buying or selling.
General Public Ownership
The general public, who are usually individual investors, hold a 33% stake in Kia. While this group can't necessarily call the shots, it can certainly have a real influence on how the company is run.
Public Company Ownership
It appears to us that public companies own 35% of Kia. It's hard to say for sure but this suggests they have entwined business interests. This might be a strategic stake, so it's worth watching this space for changes in ownership.
Next Steps:
I find it very interesting to look at who exactly owns a company. But to truly gain insight, we need to consider other information, too.
I like to dive deeper into how a company has performed in the past. You can find historic revenue and earnings in this detailed graph.
If you would prefer discover what analysts are predicting in terms of future growth, do not miss this free report on analyst forecasts.
NB: Figures in this article are calculated using data from the last twelve months, which refer to the 12-month period ending on the last date of the month the financial statement is dated. This may not be consistent with full year annual report figures.
Have feedback on this article? Concerned about the content? Get in touch with us directly. Alternatively, email editorial-team (at) simplywallst.com.
This article by Simply Wall St is general in nature. We provide commentary based on historical data and analyst forecasts only using an unbiased methodology and our articles are not intended to be financial advice. It does not constitute a recommendation to buy or sell any stock, and does not take account of your objectives, or your financial situation. We aim to bring you long-term focused analysis driven by fundamental data. Note that our analysis may not factor in the latest price-sensitive company announcements or qualitative material. Simply Wall St has no position in any stocks mentioned.